
Figures & data
Table 1. Ingredients and nutrient composition of basal diets.
Figure 1. Effect of dietary globin supplementation on body weight (g) at 1, 10, 25 and 35 days of age (MJ/kg) in male and female broiler chickens (mean ± SEM). Note: continuous line represents Globin group and dotted line represents control group; capital letters mean significant effect (p < .050) of sex (S) and/or diet (D), lowercase letters mean statistical tendency (p < .100) of sex (s) and/or diet (d) between control and Globin groups.
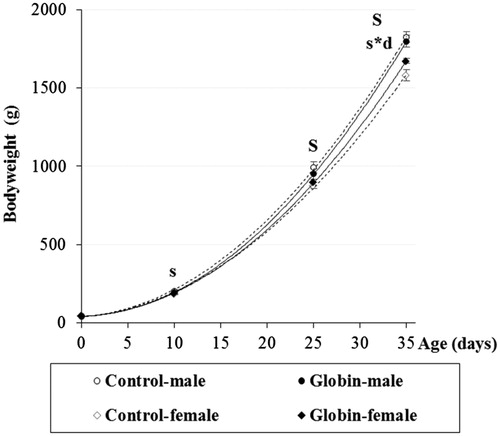
Table 2. Effect of dietary globin at a dose of 0.05% on technical performance of broiler chickens (n = 8).
Table 3. Effect of dietary Globin at a dose of 0.05% on nutrient digestibility, protein and energy efficiency and net energy for production of broiler starter feed (n = 8).