Figures & data
Table 1. Composition of the standard diet.
Table 2. Composition and antioxidant activity of the polyphenol extract from olive mill wastewater.
Figure 1. Effect of olive mill wastewater supplemented to a finishing diet on jejunum and ileum villi lengths and colon crypt depth. Bars represented as mean ± SEM.
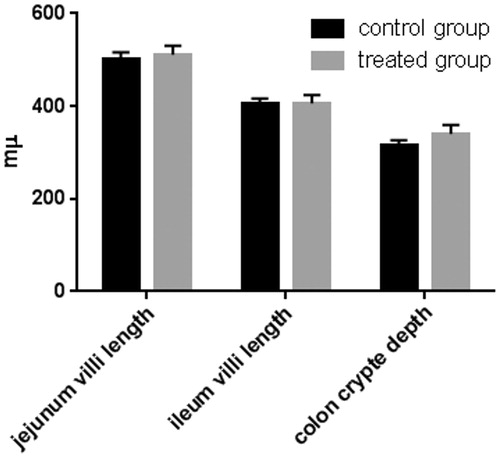
Figure 2. Effect of olive mill wastewater supplemented to a finishing diet on the count of leukocyte infiltrate in the stomach, duodenum, jejunum, ileum, caecum, and colon. Bars represented as mean ± SEM. *Annotate differences between control and experimental group at p < .05.
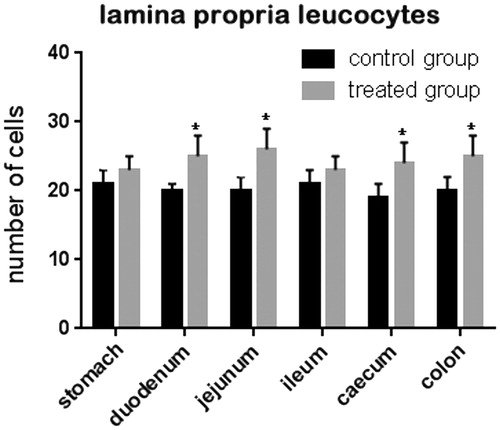
Figure 3. Effect of olive mill wastewater supplemented to a finishing diet on the count of intra-epithelial leukocytes (IEL) in the stomach, duodenum, jejunum, ileum, caecum, and colon. Bars represented as mean ± SEM. *Annotate differences between control and experimental group at p < .05.
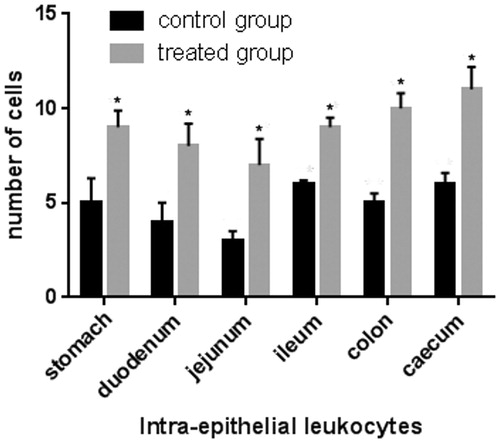
Figure 4. Immunohistochemical analysis of cyclooxygenase-2 (COX-2) in the caecum: (a) immunopositive infiltrated leukocytes in the mucosal layer of the caecum of a control pig; (b) negative control of the caecum of a control pig; (c) absence of immunopositivity in the mucosal layer of the caecum of a pig of the experimental group; and (d) immunopositive intra-epithelial leukocytes (IEL) in the epithelium of the caecum of a pig of the experimental group. Scale bars: 20 µm (a–d).
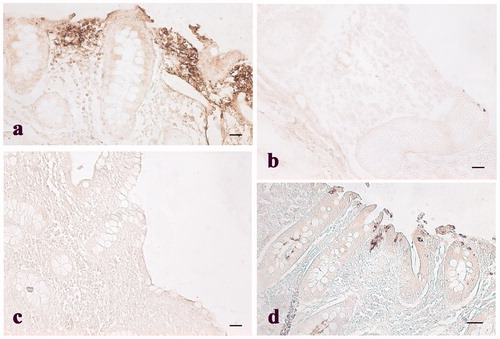
Figure 5. Immunohistochemical analysis of cyclooxygenase-2 (COX-2) in the colon: (a) Immunopositive stained leukocytes in the colon mucosal layer of control pig; (b) weak immunopositivities staining in the colon mucosal layer of a pig of the experimental group; and (c) negative control obtained from colon tissue of a control pig. Scale bars: 20 µm.
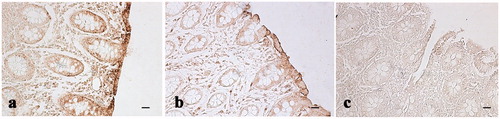
Figure 6. Immunohistochemical analysis of cyclooxygenase-2 (COX-2) in the ileum and Peyer’s patches: (a) hematoxylin–eosin staining of the ileum solitary follicle of a pig of the experimental group; (b) absence of immunopositivities staining in the same ileum follicle solitary showed in the previous picture (histological section consecutive to the previous one); (c) hematoxylin–eosin staining of a Peyer’s patch of the caecum of a control pig; and (d) various immunopositive cells (arrows) located in the same Peyer’s patch showed in the previous picture (histological section consecutive to the previous one). Scale bars: 20 µm (a and d); 10 µm (b); and 50 µm (c).
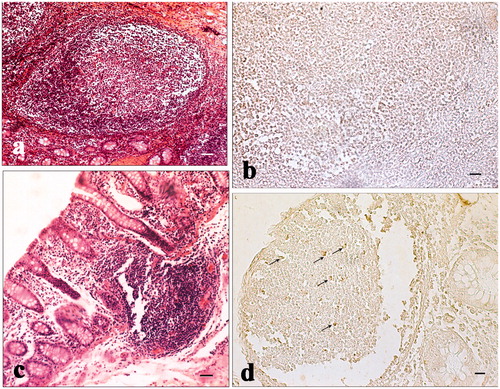
Figure 7. MGG-Quick rapid staining of leukocytes present in the peripheral blood smears: (a) neutrophilic granulocytes with lobed nucleus, (b) large lymphocyte, (c) monocyte, (d) basophilic granulocytes, and (e) eosinophilic granulocytes. Scale bars: 10 µm (a–e).
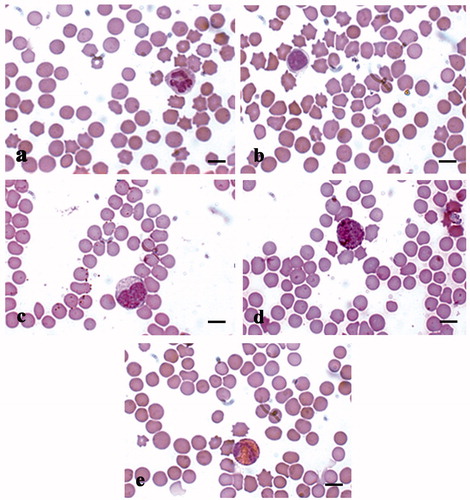
Figure 8. MGG-Quick rapid staining of leukocytes isolated from peripheral blood: (a–c) lymphocytes (thin arrows), monocytes (thick arrows), and rare red blood cells (*). Scale bars: 10 µm (a–c).
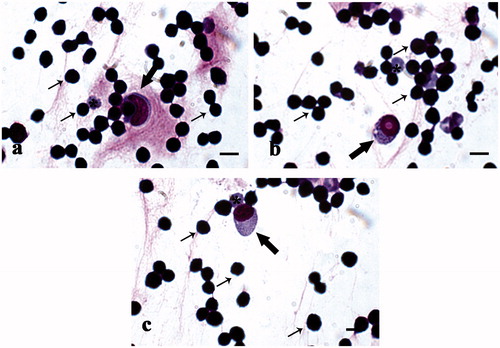
Figure 9. MGG-Quick rapid staining of fluid extract from lugs: (a) lower magnification and (b) higher magnification of extracted cell population; in detail alveolar macrophages (arrows). Scale bars: 50 µm (a) and 10 µm (b).
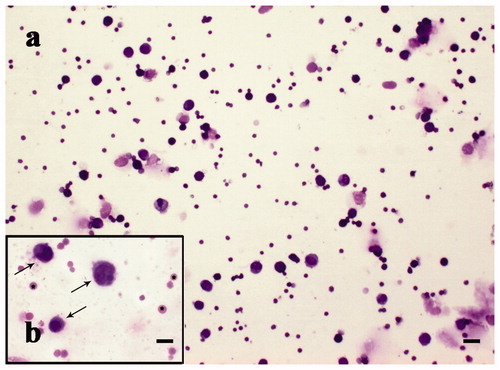
Table 3. Leukocyte formula of peripheral blood samples collected from control and experimental group.
Figure 10. Superoxide anion assay in the peripheral blood leukocytes. The anion superoxide levels were lower in pigs belonging to the experimental group compared with control animals with and without zymosan stimulation. Bars represented as mean ± SEM of three separate experiments. *Annotate differences between control and the experimental group at p < .05.
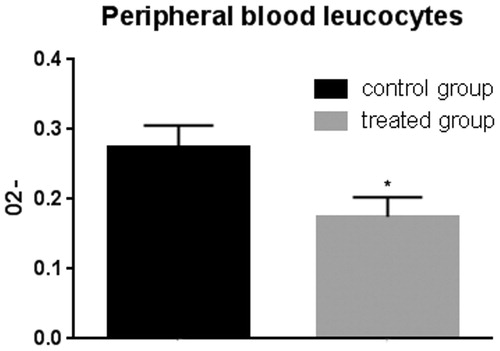
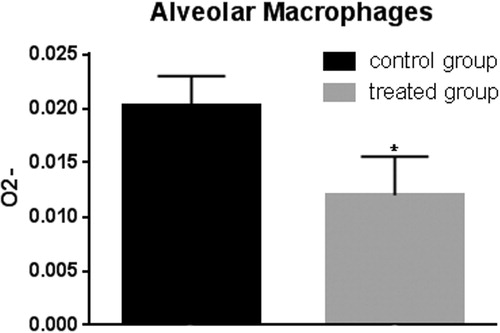
Figure 11. Superoxide anion assay in the alveolar macrophages. The anion superoxide levels were lower in pigs belonging to the experimental group compared with control animals after zymosan stimulation. Bars represented as mean ± SEM of three separate experiments. *Annotate differences between control and the experimental group at p < .05.