Figures & data
Figure 1. Complementarity between miR-122 and the predicted target site in the P4HA1 3′ UTR. (A) Schematic representation of the miR-122 binding site in the 3′ UTR of chicken P4HA1. The matched base pairs are connected by vertical lines, and the U:G wobble is connected by dots. The mutated nucleotides are in bold. (B) Sequence alignment of miR-122 target sites in P4HA1 in different species. The position of the target site in chicken P4HA1 is numbered, and the seed regions are highlighted in grey.
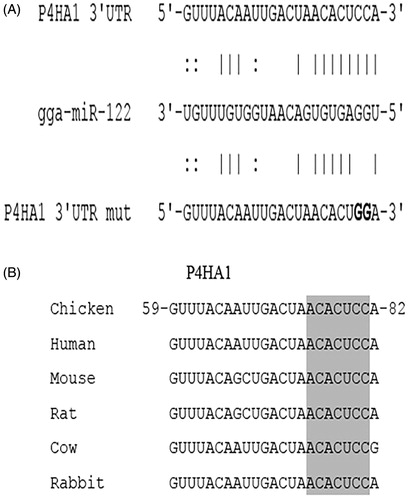
Figure 2. P4HA1 expression is up-regulated by miR-122 knockdown in chicken hepatocytes. (A) P4HA1 mRNA expression was increased by miR-122 knockdown. After transfection of control or LNA-122 in chicken hepatocytes, the expression of miR-122 was detected by real-time qRT-PCR and the expression of P4HA1 was detected by real-time qRT-PCR and RNA-seq . Sequencing data are from pooled samples of three 4-week-old chickens. Real-time qRT-PCR data are the means ± SEM of 3 independent experiments performed in duplicate and were analysed by student’s t-test. (B) P4HA1 protein expression was increased by miR-122 knockdown. After transfection of control or LNA-122 in chicken hepatocytes, the protein level of P4HA1 was detected by Western blotting and normalised to GAPDH. Left panel: Western blot analysis of P4HA1 in chicken hepatocytes transfected with LNA-122. Right panel: The protein level of P4HA1 was normalised to GAPDH, and the fold change relative to P4HA1 expression in controls is presented. Western blot data are the means ± SEM of 3 independent experiments and were analysed by student’s t-test. *p<.05; **p<.01; ***p<.001.
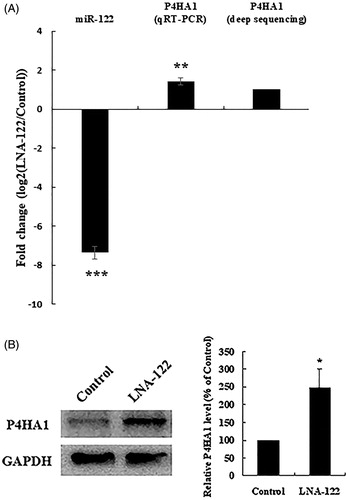
Figure 3. Expression pattern of P4HA1 mRNA in chicken tissues. The expression level of P4HA1 mRNA was measured by qRT-PCR and normalised to β-actin mRNA. Tissues from three 4-week-old chickens were analysed. Data are means ± SEM.
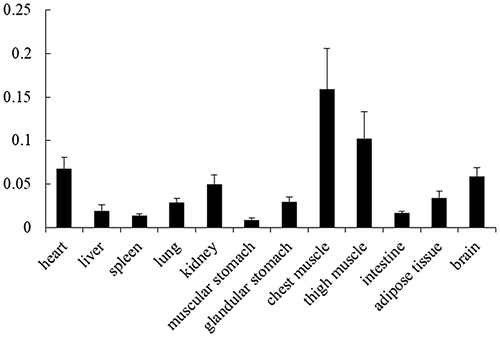
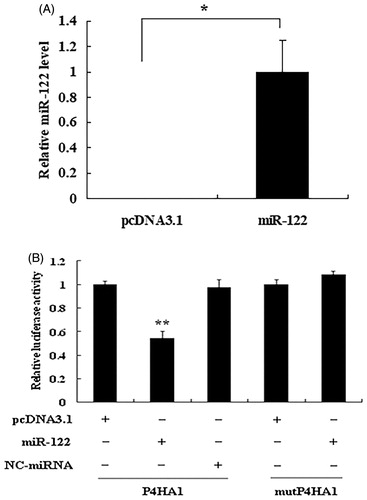
Figure 4. miR-122 directly targets the 3′ UTR of chicken P4HA1 mRNA. (A) Overexpression of miR-122 in CHO cells. After CHO cells were transfected with control vector pcDNA3.1 or miR-122 overexpression vector pcDNA3.1/miR-122, the expression levels of miR-122 were detected by real-time qRT-PCR and normalised to 18S rRNA. (B) Target validation. CHO cells were cotransfected with pMIR-P4HA1 (Firefly luciferase) and pcDNA3.1 or pcDNA3.1/miR-122 or pcDNA3.1/NC-miRNA. The binding site-mutated vector pMIR-mutP4HA1 (Firefly luciferase) was cotransfected with pcDNA3.1 or pcDNA3.1/miR-122. pRL-CMV (Renilla luciferase) was used as an internal control. Relative luciferase activity was determined by Firefly luciferase activity normalised to Renilla luciferase activity. Data are the means ± SEM of at least 3 independent experiments performed in triplicate and analysed by student’s t-test or ANOVA. *p<.05; **p<.01.