
Figures & data
Figure 1. Standard shape of the lactation curve for dairy cattle. The plot shows the milk production as function of the weeks after the parturation.
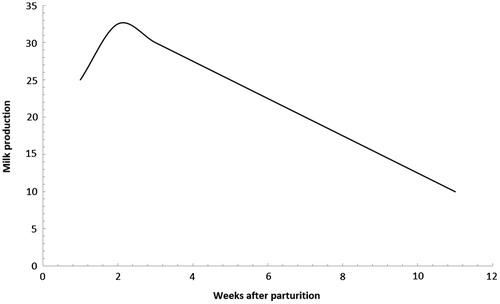
Figure 2. Plot for some lactation models: QM (dashed line), HM (dotted line), IM (dot-dashed line) and WEM (solid line).
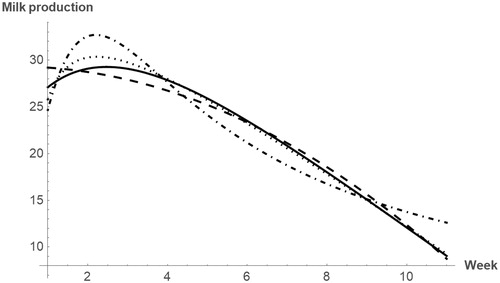
TABLE 1. Efficiencies for WM D-optimal designs.
TABLE 2. Support points of WEM locally D-optimal designs in .
TABLE 3. Efficiencies for WEM D-optimal designs.
TABLE 4. Efficiencies of locally D-optimal designs for WEM with respect to those for WM, for different values.
TABLE 5. Support points for D-optimal designs for some lactation models.
TABLE 6. Efficiency study for optimal design for lactation models.