Figures & data
Table 1. The major fatty acid profiles of oil and basal diet (% of total fatty acids).
Table 2. The characteristic of primers used in real-time RT-PCR assays.
Figure 1 Effects of dietary treatments on the rate of ovulation (hen-day egg production %). The rate of ovulation was 89.57, 91.08, 92.14 and 95.89% in control, E, n-3 + E and n-3 treatments, respectively. Experimental groups (n = 17 in each group): basal diet +1.5% sunflower oil (control; C); basal diet +1.5% sunflower oil +1.1 U alpha-tocopherol/hen/day (E); basal diet+ 1.5% fish oil +1.1 U alpha-tocopherol/hen/day (n-3 + E) and basal diet +1.5% fish oil (n-3). Data are presented as means ± SEM (a,bGroups followed by the same letter are not significantly different at the p < .05).
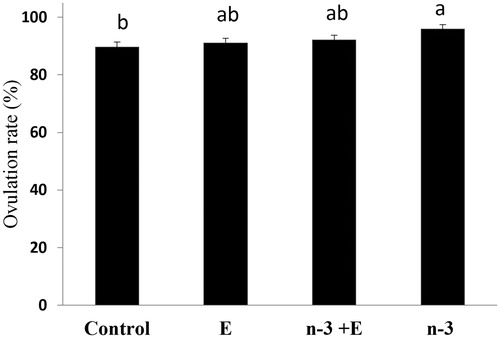
Table 3. Effects of diets on different reproductive morphology parameters in laying hens.
Figure 2 The percentage of intact primordial, primary and prehierarchical follicles in different experimental groups (n = 10 in each group): basal diet +1.5% sunflower oil (control; C); basal diet +1.5% sunflower oil +1.1 U alpha-tocopherol/hen/day (E); basal diet+ 1.5% fish oil +1.1 U alpha-tocopherol/hen/day (n-3 + E) and basal diet +1.5% fish oil (n-3). Values are given as mean ± SEM. Groups followed by the same letter are not significantly different at p < .05.
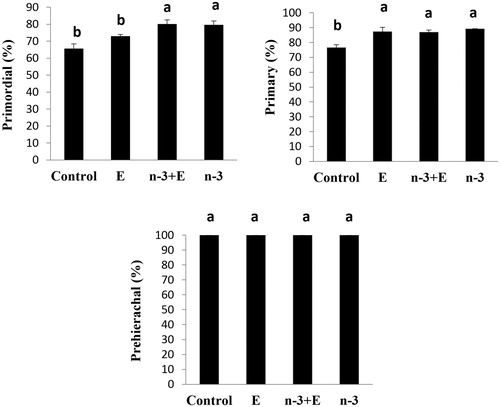
Figure 3 Laying hen ovarian tissues (n = 10 in each group). Intact primordial follicles (dash arrows) and atretic primordial follicles (arrow head). A: Control (basal diet), B: Vitamin E, C: n-3 + E, D: n-3. Basal diet +1.5% sunflower oil (control; C); basal diet +1.5% sunflower oil + 1.1 U alpha-tocopherol/hen/day (E); basal diet + 1.5% fish oil + 1.1 U alpha-tocopherol/hen/day (n-3 + E) and basal diet + 1.5% fish oil (n-3). Hematoxylin & Eosin staining (scale bar = 100 μm). Follicles with a maximum size of 80 μm were counted as primordial follicles. (Only the follicles with a visible nucleus were counted).
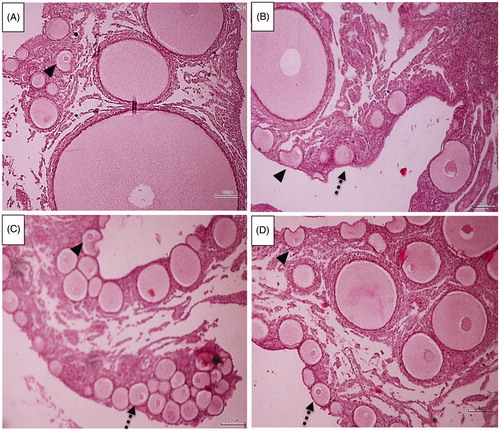
Table 4. Effect of dietary treatments on fatty acid concentration of blood serum (% of total fatty acids).
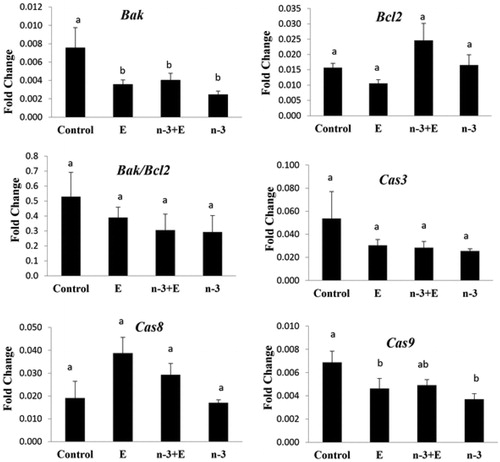
Figure 4 Fold change of Bak, Bcl-2, Caspase 3, Caspase 8, and Caspase 9 in experimental groups (n = 6 in each group): basal diet +1.5% sunflower oil (control; C); basal diet +1.5% sunflower oil +1.1 U alpha-tocopherol/hen/day (E); basal diet+ 1.5% fish oil +1.1 U alpha-tocopherol/hen/day (n-3 + E) and basal diet +1.5% fish oil (n-3). Values are given as mean ± SEM. Groups followed by the same letter are not significantly different at p < .05.