Figures & data
Table 1. Experimental design.
Table 2. Composition (mean and SD, expressed as DM) and main nutrient characteristics of TMRs used during the trial.
Table 3. Mean differences of DM distributed daily and of its content (%) of crude protein (CP), NDF and starch as consequence of the variability in the DM content of silagesTable Footnotea.
Table 4. Difference of DM (kg/head d – in brackets calculated as %) of real diet with or without operator error respect to target diet as consequence of the variability in the DM content of silagesTable Footnotea.
Figure 1. Urea (a), total cholesterol (b), Ca (c), and Zn (d) in plasma of dairy cows fed TMR managed by using the precision feeding. The precision feeding system measured daily the DM of each silage loaded in the TMR wagon and did not suggest correction on the amount of silages to be loaded (PF-OFF) or suggested the correction of the amount of silages to be loaded according the result of their DM (PF-ON). Values are least squares means, and vertical bars represent SEM. (α, β: p < .10; a, b: p < .05; A, B: p < .001).
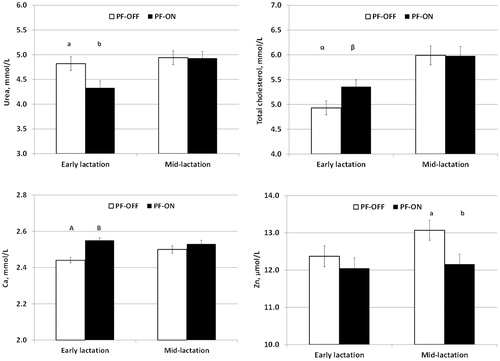
Table 5. Plasma variables (Least Squares Means) observed in dairy cows fed TMR managed by using (PF-ON) or not (PF-OFF) a precision feeding system.
Table 6. DM, pH, and VFA observed in samples of faeces collected from dairy cows fed TMR managed by using (PF-ON) or not (PF-OFF) a precision feeding system.
Table 7. Milk yield and milk characteristics (Least Squares Means) observed in dairy cows fed TMR managed by using (PF-ON) or not (PF-OFF) a precision feeding system.
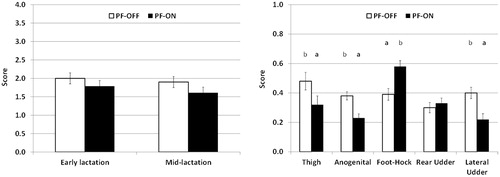
Figure 2. Global (a) and specific (b) cleanliness score of anatomical areas in dairy cows fed TMR managed by using the precision feeding. The precision feeding system measured daily the DM of each silage loaded in the TMR wagon and did not suggest correction on the amount of silages to be loaded (PF-OFF) or suggested the correction of the amount of silages to be loaded according the result of their DM (PF-ON). Values are least squares means, and vertical bars represent SEM. (a, b: p < .05).