
Figures & data
Table 1. Summary of papers used for meta-analysis.
Figure 1. Forest plot of the influence of soybean oil on milk production of dairy cows based on Standardised Mean Differences (SMD). The mean effect size, calculated according to a random effects model, is indicated by the diamond at the bottom. The size of the squares illustrates the weight of each study relative to the mean effect size. Smaller squares represent less weight.
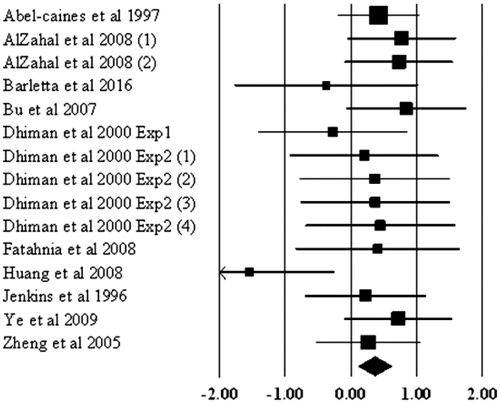
Figure 2. Funnel plot for analysing publication bias of milk production. Empty circles indicate observed values.
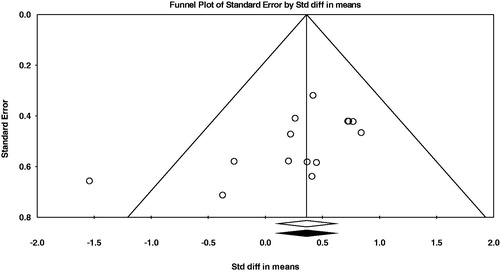
Table 2. Effect size and heterogeneity for the effect of soybean oil on dry matter intake, milk production and milk composition in dairy cows.
Figure 3. Forest plot of the influence of soybean oil on milk fat percentage in milk of dairy cows based on Standardised Mean Differences (SMD). The mean effect size, calculated according to a random effects model, is indicated by the diamond at the bottom. The size of the squares illustrates the weight of each study relative to the mean effect size. Smaller squares represent less weight.
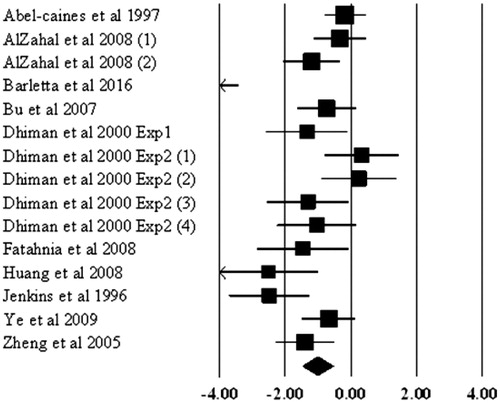
Figure 4. Funnel plot for analysing publication bias of milk fat percentage. Empty circles indicate observed values.
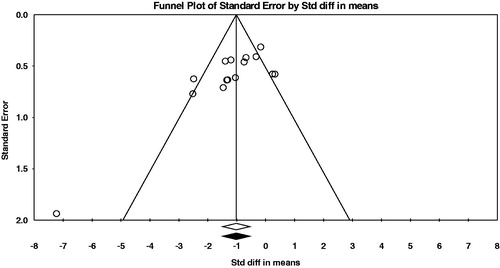
Table 4. Summary of meta-regression analysis.
Figure 5. Forest plot of the influence of soybean oil on C18:2 in milk of dairy cows based on Standardised Mean Differences (SMD). The mean effect size, calculated according to a random effects model, is indicated by the diamond at the bottom. The size of the squares illustrates the weight of each study relative to the mean effect size. Smaller squares represent less weight.
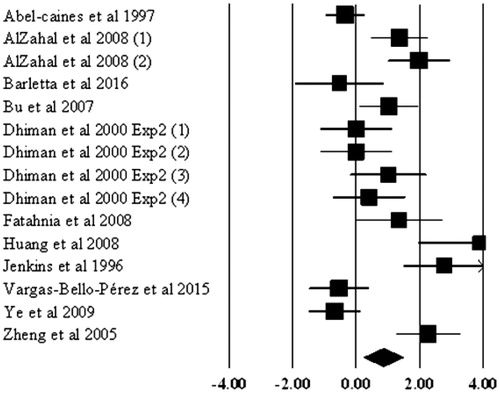
Figure 6. Funnel plot for analysing publication bias of C18:2 in milk. Empty circles indicate observed values and solid dots are the potentially missing studies.
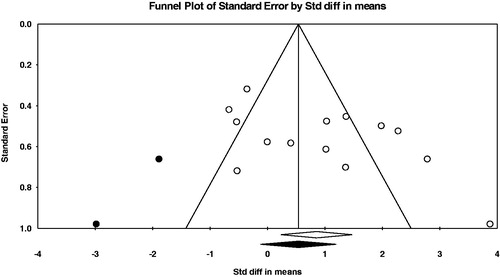
Table 3. Effect size and heterogeneity for the effect of soybean oil on milk fatty acid profiles in dairy cows.