Figures & data
Table 1. Primers designed for qPCR based on bovine genome sequences.
Figure 1. Distributions of the CNV of the GPC1 gene in five yak breeds. (A) Scatter plot of CNV of the GPC1 gene in five yak breeds (n = 30). (B) The frequency of copy numbers (0 and 1 = loss, 2= normal and >2= gain copy number types) in five yak populations. CNV: copy number variation.
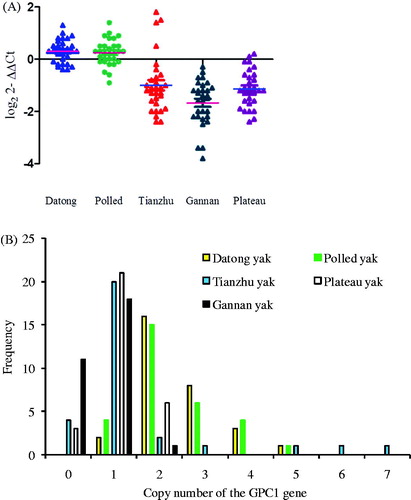
Table 2. Analysis of the association between CNVs in the GPC1 gene and growth traits in Datong yak breeds.
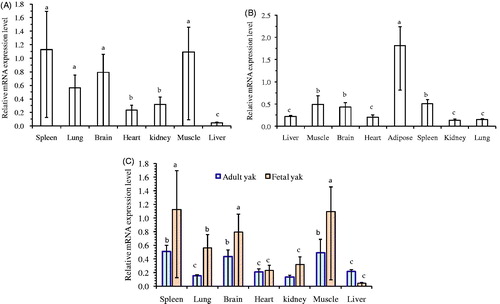
Figure 2. Expression profiling of the GPC1 gene at two ages of Datong yak. (A) Expression pattern of the GPC1 gene in foetal yak. (B) Expression Pattern of the GPC1 gene in the adult yak. (C) Comparison of expression of GPC1 gen in two ages. The error bar indicated the standard deviation (SD). Different letters indicate significant difference (p < .05). CNV: copy number variation.