
Figures & data
Table 1. Data coding by levels.
Figure 1. Biomodeling of the lactation curve in Murciano-Granadina goats and their persistency. PY: peak yield; IP: initial persistency; FP: final persistency; TP: total persistency.
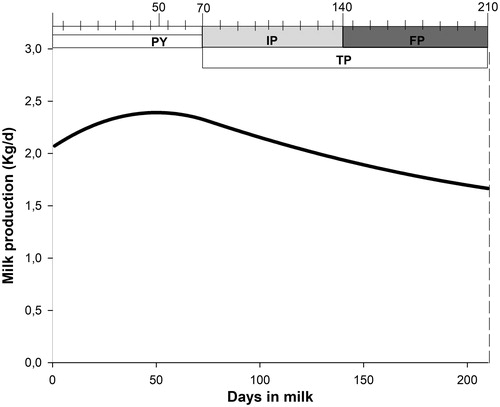
Figure 2. Biomodeling of the lactation curve in Murciano-Granadina goats: PY: peak yield; IP: initial persistency; FP: final persistency; TP: total persistency according to variation factors: (a) dairy control nuclei of Almeria, Cordoba and Granada; (b) type of kidding (single, twin, triplet and upper), (c) lactation number (first, second, third, fifth and upper); and (d) season (spring, summer, fall and winter); all adjusted by Spline.
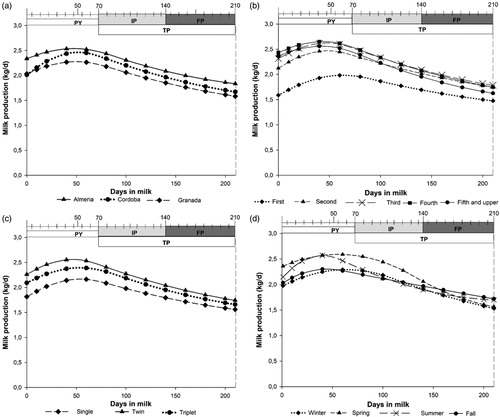
Table 2. Biomodeling of the lactation curve in Murciano-Granadina goat for knot, productions and persistency fitted by Spline function including full data set and to each level of the factors analysed.