Figures & data
Figure 1. Geographical map of the North Italy. The dark points represent the regular grid of 30 × 30 km from the agro-weather national database (BDAN) used in the study. The marked area corresponds to the production area indicated in the production specification rules of Grana Padano cheese (www.granapadano.it).
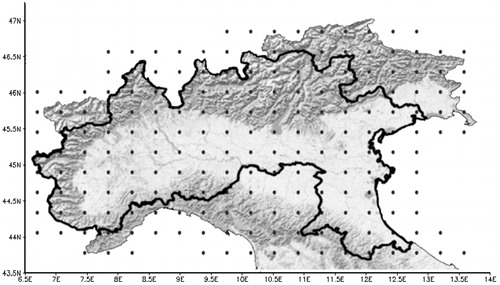
Table 1. Thresholds of THI indicating the beginning of heat stress and yield loss of milk, protein and fat for each unit of increment of THI above the threshold.
Table 2. Monthly anomalies of temperature, THI and precipitation observed in the recent period (2001–2010) compared with the thirty years of reference 1971–2000.
Figure 2. The Gaussen-Bagnouls classification method: (a) 1971–2000 and (b) 2001–2010. Monthly temperature and precipitation are related to describe the climatic feature of the area of GP: humid climate if P > 3T; semi-humid climate if 2T < P < 3T and arid climate if P < 2T. GP: Grana Padano.
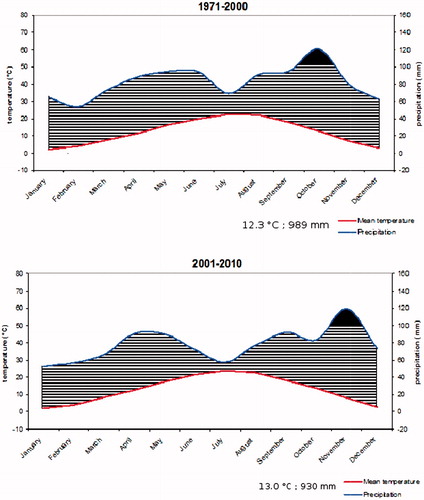
Figure 3. Yearly anomalies of future scenarios 2021–2050 versus thirty years reference 1981–2010 in the production area of Grana Padano (marked): (a) maximum temperature (in °C); (b) minimum temperature (in °C); (c) Temperature Humidity Index (unit of THI); (d) precipitation (in mm). THI: temperature-humidity index.
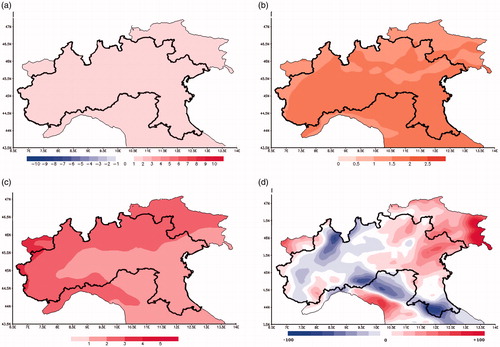
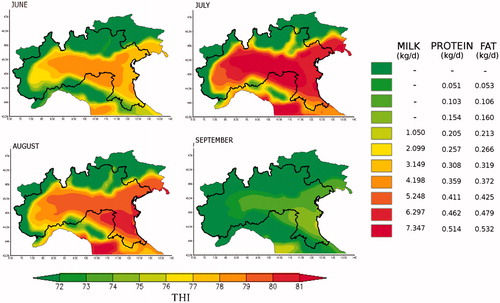
Figure 4. THI-related risk of milk, protein and fat yield loss (kg/d) in the production area of Grana Padano (marked) during the period 1971–2000 in the months of June, July, August and September. The colours from green to red indicate increasing values of THI (from 72 to 81) to which correspond different degree of production loss: null (green) and maximum (red). THI: temperature-humidity index.
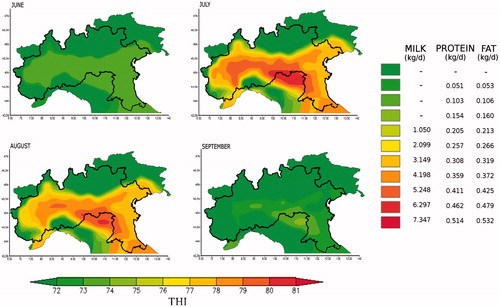
Figure 5. THI-related risk of milk, protein and fat yield loss (kg/d) in the production area of Grana Padano (marked) during the period 2001–2010 in the months of June, July, August and September. The colours from green to red indicate increasing values of THI (from 72 to 81) to which correspond different degree of production loss: null (green) and maximum (red).THI: temperature-humidity index.
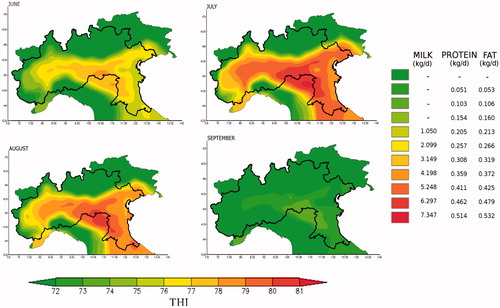
Figure 6. THI-related risk of milk, protein and fat yield loss (kg/d) in the production area of Grana Padano (marked) during the period 2021–2050 in the months of June, July, August and September. The colours from green to red indicate increasing values of THI (from 72 to 81) to which correspond different degree of production loss: null (green) and maximum (red). THI: temperature-humidity index.