
Figures & data
Table 1. Experimental groups.
Figure 1. Electric fence system designed around experimental hives. Fence materials include wood post (A), fence wire (1.5 mm in diameter) (B), fence energiser (C), double insulated wire (D) solar panel (E), insulator (F), grounding rod with clamp (G), grounding rod for hive covered with insect screen (H), wooden hive (I), insulated hive (J) and wooden hive covered with insect screen (K).
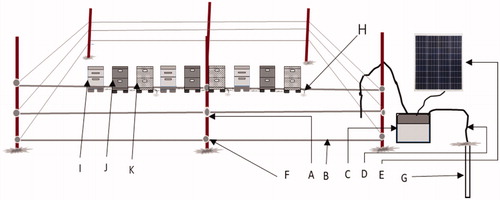
Table 2. The values of the electric field and electromagnetic radiation measured in experimental hives.
Figure 2. Mean sting number of the hive types (number/colony). W: wood; WCS: wood covered with an insect screen; I: insulated.
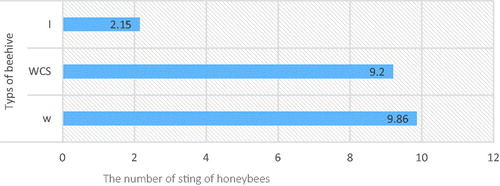
Figure 3. Mean sting number of the experimental groups (number/colony).
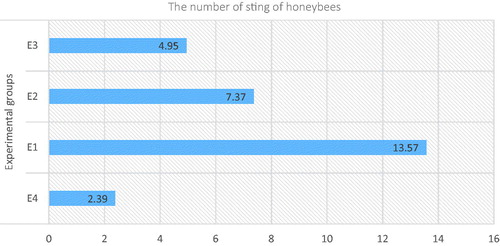
Figure 4. Mean number of sting according to measurement periods (number/colony).
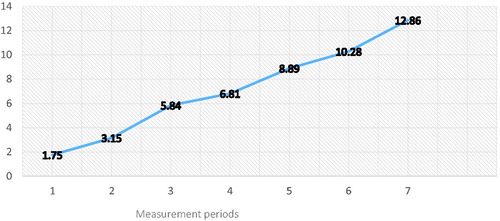
Table 3. Mean data on the number of robber and flying honeybees with the number of frames covered with the honeybee.
Table 4. The results of weight gain during the nectar flow period, brood area and honey yield of experimental honeybee colonies.