
Figures & data
Table 1. Clinical findings in control and affected buffaloes by diffuse peritonitis.
Figure 1. Ultrasonography of an abdominal cavity showing an echogenic fibrin interspersed with an anechoic exudate forming the fibrin network (fibrinous peritonitis) as detected by a convex transducer (A) and a linear transducer (B). 1. Abdominal wall. 2. Echogenic fibrin. 3. Anechoic exudate.
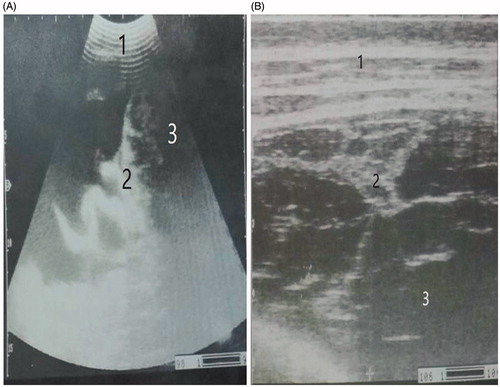
Figure 2. Ultrasonography of an abdominal cavity showing hypoechoic material represented as pus (suppurative peritonitis) by a convex transducer (A) and a linear transducer (B). 1. Abdominal wall. 2. Hypoechoic material (pus).
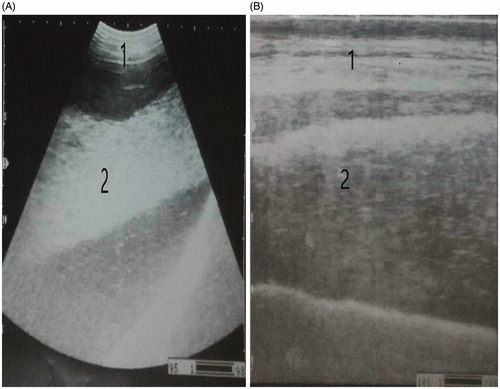
Figure 3. Levels of serum Tp, albumin, globulin, Hp and Fb of the control and buffaloes affected by diffuse peritonitis. Values are expressed as median ± standard deviation. Different letters indicate significance difference (p < .05) resulting from non-parametric Kruskal–Wallis test.
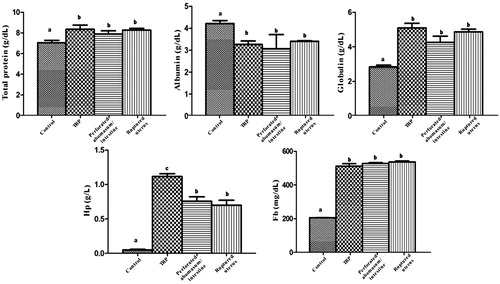
Figure 4. Levels of serum NO, CAT, MDA and pepsinogen of the control and buffaloes affected by diffuse peritonitis. Values are expressed as median ± standard deviation. Different letters indicate significance difference (p < .05) resulting from non-parametric Kruskal–Wallis test.
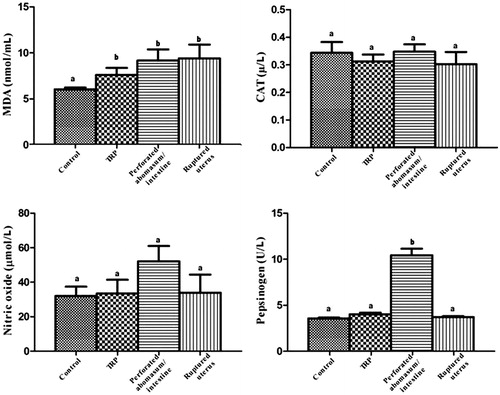
Table 2. Necropsy findings shows the different causes of 20 buffaloes affected by diffuse peritonitis.