Figures & data
Table 1. Descriptive statistics of technological, structural and productive variables in Manchega sheep breed.
Figure 1. Representation of results in each discriminant model for the groups of farms (Viability and BP) in Manchega sheep breed, defined by the axis built by the first canonical variables (CAN 1 and CAN 2).
![](/cms/asset/93a7bb1d-d3c1-4981-bd78-0e4ae1c97fcc/tjas_a_1609381_ilg0002.jpg)
![](/cms/asset/b1a54b2f-f6d6-450e-833c-eb37fdb1531c/tjas_a_1609381_ilg0003.jpg)
![](/cms/asset/e141749b-6e52-4aa9-9a23-92e5cabcbd03/tjas_a_1609381_ilg0004.jpg)
![Figure 1. Representation of results in each discriminant model for the groups of farms (Viability and BP) in Manchega sheep breed, defined by the axis built by the first canonical variables (CAN 1 and CAN 2). Display full size viable with genetic improvement programme (BP), Display full size non-viable with BP, Display full size viable without BP, Display full size non-viable without BP.](/cms/asset/689d4ada-036f-4967-8aa3-38fa29b14d6e/tjas_a_1609381_f0001_c.jpg)
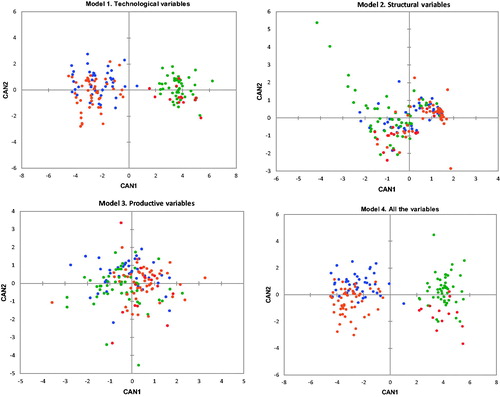
Table 2. Results of the canonical discriminant analysis in Manchega sheep breed.
Table 3. Individual results for variables included in the four canonical discriminant models (variables with the highest discriminate power are bold) and correlations of each variable with the canonical variables.
Figure 2. Plot of the cluster analysis developed for the four groups of farms evaluated in Manchega sheep breed.
![Figure 2. Plot of the cluster analysis developed for the four groups of farms evaluated in Manchega sheep breed.](/cms/asset/5a4843b6-1587-4fee-8b2c-44a06927dd47/tjas_a_1609381_f0002_c.jpg)
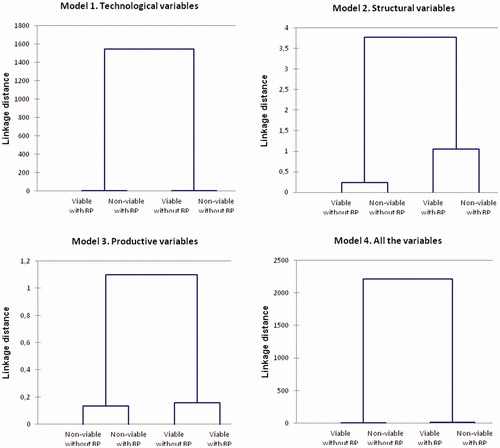
Table 4. Variables that discriminated between pair of groups using step – wise discriminant analysis in Manchega sheep breed.