Figures & data
Figure 1. System boundary that describes the farm system was analysed and inputs and outputs were taken into account in LCA.
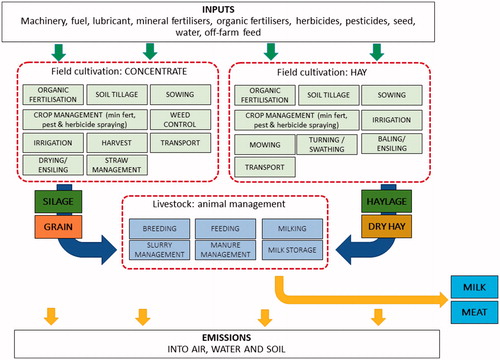
Table 1. Main inventory data about the on-farm field cultivation area. The sum of the land area dedicated to each crop is given as absolute value (ha) and as percentage of the total area of farms analysed in the study.
Table 2. Main inventory data about herds and milk production.
Table 3. Average environmental impact of 1 kg FPCM produced by the farms that sell milk to each of the four dairies for GP cheese production.
Table 4. Average environmental impact of 1 kg FPCM produced by the farms that sell milk to each of the four dairies for PR cheese production.
Table 5. Results of the factor analysis. In bold are reported the loading values with the main relevance on the factors (>0.6 as absolute value).
Figure 2. Results of the PCA analysis with three components.
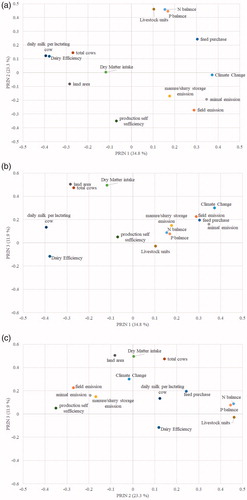
Table 6. Means and standard deviations for the main variables that define the six clusters.
Table 7. Results of GLM with LSMEANS values per farm characteristics.
Table 8. Results of GLM with LSMEANS values per impact category.
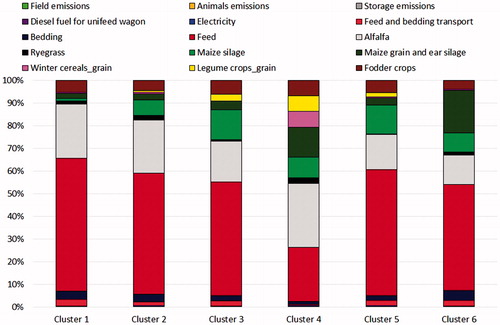
Figure 3. Hotspot processes of every cluster to CC impact category. All processes included in the study are reported in the legend.
CC: climate change.
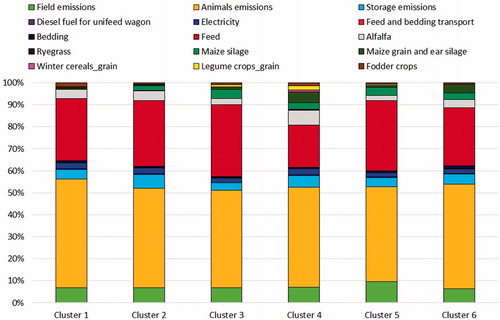
Figure 4. Hotspot processes of every cluster to FE impact category. All processes included in the study are reported in the legend.
FE: freshwater eutrophication (kg P eq).
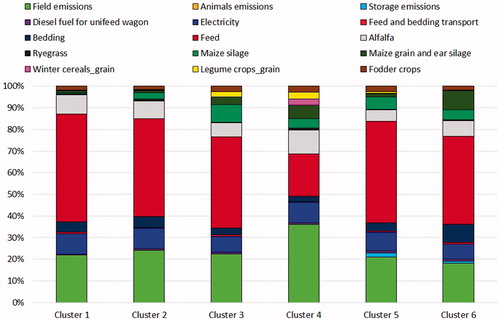
Figure 5. Hotspot processes of every cluster to LU impact category. All processes included in the study are reported in the legend.
LU: land use (kg carbon deficit).
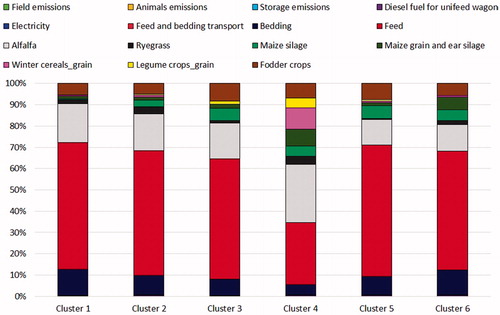
Figure 6. Hotspot processes of every cluster to MFRD impact category. All processes included in the study are reported in the legend.
MFRD: mineral, fossil and renewable resources depletion (kg Sb eq).