Figures & data
Table 1. Experimental design.
Table 2. The TMR formulated by the nutritionist (TMR sampled in the mixing wagon).
Table 3. Chemical values (LS means ± SEM) of samples collected on the alley according to loading level, cutting and mixing time (n = 225).
Figure 1. Chemical parameters difference of the formulated ratio vs. the collected samples (on the x axis, from the bottom, loading level, cutting and mixing times combinations, as reported in the experimental design.
CP: crude protein; EE: ether extract; NDF: neutral detergent fibre (NDF); DM: dry matter
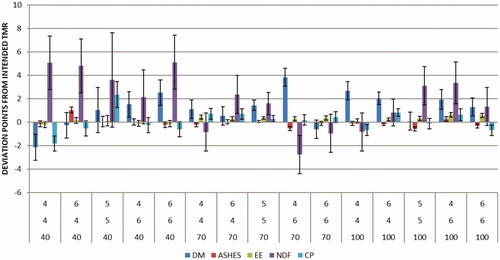
Table 4. Statistical significance of data analysis related to the difference of chemical characteristics of each collected sample compared to the chemical characteristics of the diet sampled in the mixer.
Table 5. List of the most efficient combination for loading, cutting and mixing times expressed by sums of the deviations of each chemical parameter collected from along the alley to formulated TMR.
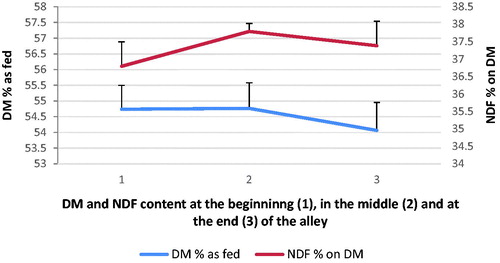
Figure 2. DM and NDF content variation of the diet samples collected along the alley.
DM: dry matter; NDF: neutral detergent fibre.