Figures & data
Table 1. Proximate analysis and concentrations of elements of the kibbles administered to the dog during the study.
Figure 1. Average daily intake of kibbles during the study. A, B and C denote means significantly different for p < .01. G1: Growing dogs of small size, fed K1 diet; G2: Growing dogs of medium size, fed K2 diet; G3: Adult dogs of medium size, fed K3 diet; G4: Adult dogs of small size, fed K4 diet. For K1, K2, K3 and K4 diets, see .
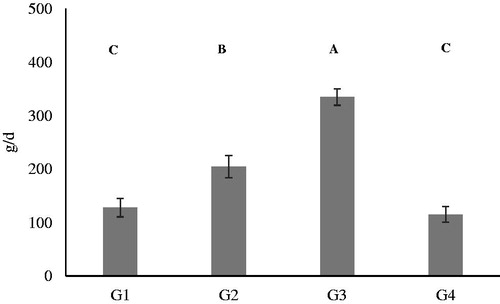
Figure 2. Effect of the diets on the mean concentrations of Al, Cu, Mn and Zn in the hair of dogs and reported as natural logarithm. These elements significantly differed between groups of dogs () and the data reported are the average concentrations of the hair sampled at the beginning of the study (D0) and after 60 days (D60). Within each diagram, a, b denote means which significantly differ for p < .05 and A, B denote means which significantly differed for p < .01. G1: Growing dogs of small size, fed K1 diet; G2: Growing dogs of medium size, fed K2 diet; G3: Adult dogs of medium size, fed K3 diet; G4: Adult dogs of small size, fed K4 diet. For K1, K2, K3 and K4 diets, see Table 1.
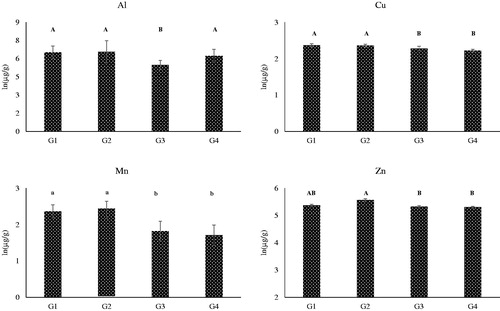
Table 2. Mean concentrations and number of samples below the detection limits of the elements in the hair sampled from dog fed commercial diets at the beginning of the study (D0) and after 60 days (D60).
Table 3. Results of the statistical analysis and estimated mean concentrations of the elements in the hair sampled from dog fed commercial diets at the beginning of the study (D0) and after 60 days (D60). Since data were not normally distributed, a natural logarithmic transformation was applied.
Figure 3. Effect of the time of sampling on the concentration of K, and Li and Na in the hair of dogs at the beginning (D0) and after 60 days (D60) of the study. These elements significantly differed between time of sampling for the groups G1, G2 G3 and G4 (). G1: Growing dogs of small size, fed K1 diet; G2: Growing dogs of medium size, fed K2 diet; G3: Adult dogs of medium size, fed K3 diet; G4: Adult dogs of small size, fed K4 diet. For K1, K2, K3 and K4 diets, see Table 1.
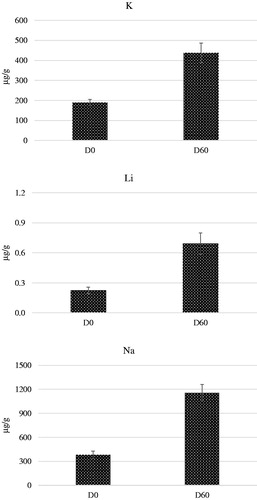
Figure 4. Estimated means of cortisol concentrations in the hair samples regrowth after 60 days from the beginning of the study. G1: Growing dogs of small size, fed K1 diet; G2: Growing dogs of medium size, fed K2 diet; G3: Adult dogs of medium size, fed K3 diet; G4: Adult dogs of small size, fed K4 diet. For K1, K2, K3 and K4 diets, see Table 1.
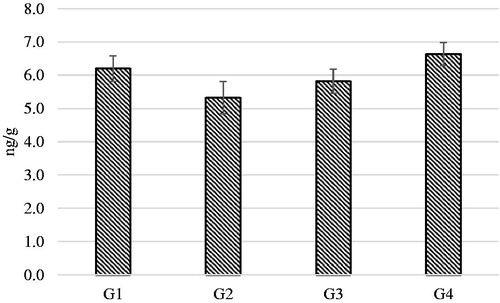
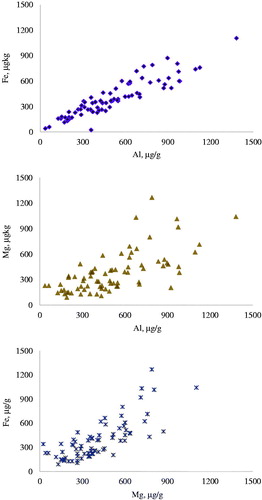
Figure 5. Significant correlations (p < .01; n = 78) between the concentrations of Aluminium and Iron (Al vs Fe; r = 0.922), Aluminium and Magnesium (Al vs Mg; r = 0.715) and Magnesium and Iron (Fe vs Mg; r = 0.978) in the hair of the 4 groups of dogs fed different diets. Correlations were calculated for the hairs sampled at the beginning of the study and after 60 days of regrowth (n = 78).