Figures & data
Table 1. Experimental groups and diets.
Table 2. Production parameters of rabbits measured between 49 and 70 days of age (means, SE).
Table 3. Blood clinical biochemical parameters affected by treatments, examined at the end of the experiment (70 days of age) (means, SE).
Figure 1. (a) Glutathione-peroxidase activity (GPx, U/g 10,000 g supernatant protein) and (b) malondialdehyde concentration (MDA, µmol/g wet weight) in the kidney examined at the end of the experiment (70 days of age). C: control; CT: control + T-2; B: B. cereus; BT: B. cereus+T-2; M: MOS; MT: MOS + T-2; BM: B. cereus+MOS; BMT: B. cereus+MOS + T-2. n = 6/group; MOS: mannan oligosaccharide; T-2: T-2 toxin. a,bSignificant (p < .05) differences between treatments.
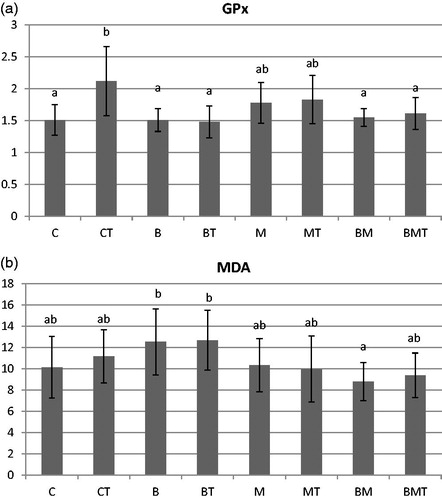
Figure 2. (a) OVA-specific IgG concentration (mg/mL) of the blood plasma and (b) phagocytic activity (%) of the macrophage cells isolated from the blood at the end of the experiment (70 days of age). C: control; CT: control + T-2; B: B. cereus; BT: B. cereus+T-2; M: MOS; MT: MOS + T-2; BM: B. cereus+MOS; BMT: B. cereus+MOS + T-2. n = 6/group; MOS: mannan oligosaccharide; T-2: T-2 toxin. a,bSignificant (p<.05) differences between treatments.
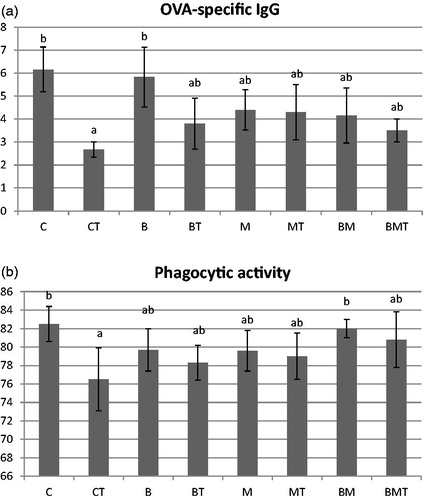
Figure 3. (a) Interferon-γ and (b) interleukin-2 measured from the gut mucosa at the end of the experiment (70 days of age). Results are given as Ct (cycle threshold) values. C: control; CT: control + T-2; B: B. cereus; BT: B. cereus+T-2; M: MOS; MT: MOS + T-2; BM: B. cereus+MOS; BMT: B. cereus+MOS + T-2. n = 6/group; MOS: mannan oligosaccharide; T-2: T-2 toxin. a,b,c,dSignificant (p<.05) differences between treatments.
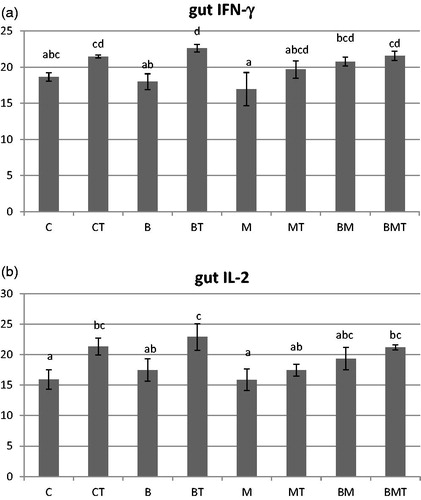
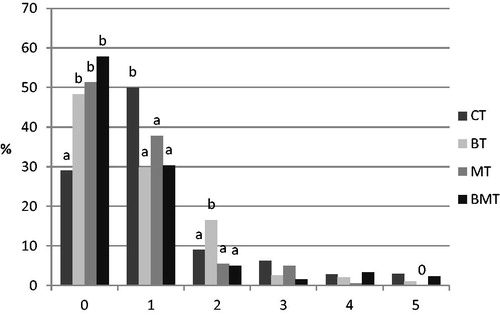
Figure 4. Results of the comet assay performed with lymphocytes isolated from the toxin treated animals at the end of the experiment (70 days of age). Results are expressed as frequency (%) of the comets classified into 0–5 scores according to the severity of DNA damage. CT: control + T-2; BT: B. cereus+T-2; MT: MOS + T-2; BMT: B. cereus+MOS + T-2. n = 100 cell/animal, n = 6 animal/group. a,bSignificant (p<.05) differences between treatments. 0: no cell classified to that category.