Figures & data
Table 1. The average chemical composition (on DM basis, excluded humidity) of feed from swine farms (F1 n = 4, F2 n = 4, F3 n = 4, F4 n = 4) per phase: gestation, farrowing, weaning and finishing, and cattle farms (F5 n = 2, F6 n = 2, F7 n = 2, F8 n = 2) per phase: calves and lactation.
Table 2. The average chemical composition (on DM basis, excluded humidity) of faeces from swine farms (F1 n = 4, F2 n = 4, F3 n = 4, F4 n= 4) per phase: gestation, farrowing, weaning and finishing, and cattle farms (F5 n = 2, F6 n = 2, F7 n = 2, F8 n = 2) per phase: calves and lactation.
Figure 1. The average concentration of zinc content in feed from different swine phases (gestation, weaning, farrowing, finishing) in considered swine farms (F1–F4) located in northern Italy. The red line represents maximum permitted level of zinc as nutritional additive in feed for pigs (150 mg/kg; EC N° 1831/2003; EU Citation2016/1095). The average humidity content (% as f.w.) in swine feed (with SE): 11.02 ± 1.70 for gestation; 11.13 ± 1.66 for farrowing; 8.83 ± 1.60 for weaning; 9.81 ± 1.28 for finishing. Data are presented as least-squares means and SEM.
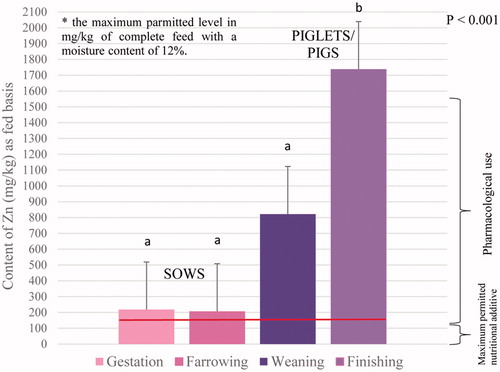
Figure 2. The average concentration of copper content in feed from different swine phases (gestation, weaning, farrowing, finishing) in considered swine farms (F1–F4) located in northern Italy. The red line represents maximum permitted level of copper as nutritional additive in feed for pigs (weaning – 150 mg/kg, finishing – 100 mg/kg; above 12 weeks – 25 mg/kg; EC N° 2018/1039). The average humidity content (% as f.w.) in swine feed (with SE): 11.02 ± 1.70 for gestation; 11.13 ± 1.66 for farrowing; 8.83 ± 1.60 for weaning; 9.81 ± 1.28 for finishing. Data are presented as least-squares means and SEM.
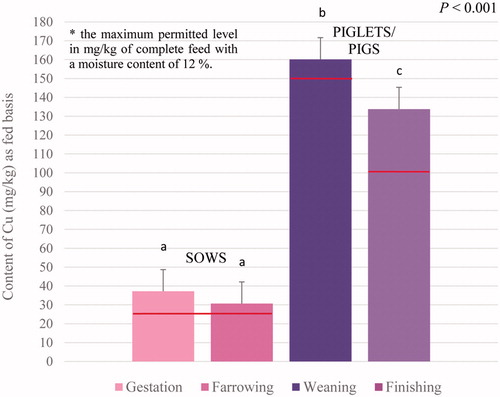
Figure 3. The average concentration of Zn content (A) in feed with the red line represents maximum permitted level of zinc as nutritional additive in feed for cattle (calves – 180 mg/kg; other – 120 mg/kg; EC N° 1831/2003, 2016/1095) and for Cu content (B) in feed with the red line represents maximum permitted level of copper as nutritional additive in feed for cattle (bovines before rumination – 15 mg/kg; other bovines – 30 mg/kg; EC N° 2018/1039) from different cattle phases (calves, lactation) in considered cattle farms (F5–F8) located in northern Italy. The average humidity content (% as f.w.) in cattle feed (with SE): 11.42 ± 1.18 for calves; 49.69 ± 3.38 for lactation. Data are presented as least-squares means and SEM.
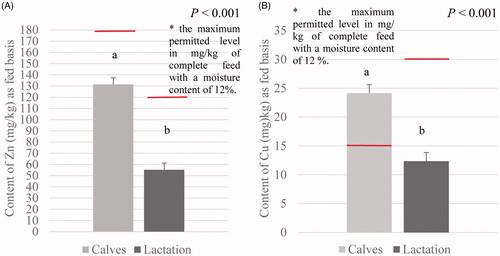
Figure 4. The average concentration of Zn content (mg/kg of f.w. – fresh weight) in faeces from different swine phases (gestation, weaning, farrowing, finishing) in considered swine farms (F1–F4) located in northern Italy. The average humidity content (% as f.w.) in swine faeces (with SE): 72.78 ± 1.75 for gestation; 71.65 ± 1.73 for farrowing; 70.13 ± 2.46 for weaning; 73.52 ± 1.10 for finishing. Data are presented as least-squares means and SEM.
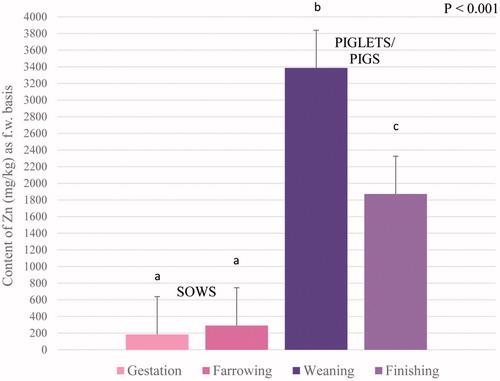
Figure 5. The average concentration of Cu content (mg/kg of f.w. – fresh weight) in faeces from different swine phases (gestation, weaning, farrowing, finishing) in considered swine farms (F1–F4) located in northern Italy. The average humidity content (% as f.w.) in swine faeces (with SE): 72.78 ± 1.75 for gestation; 71.65 ± 1.73 for farrowing; 70.13 ± 2.46 for weaning; 73.52 ± 1.10 for finishing. Data are presented as least-squares means and SEM.
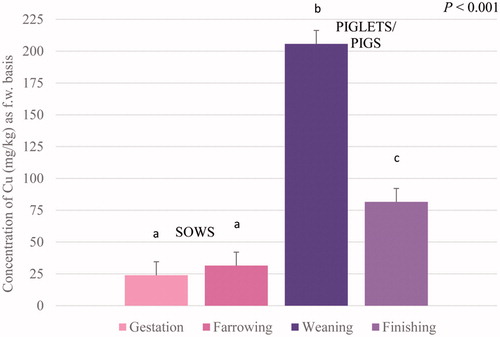
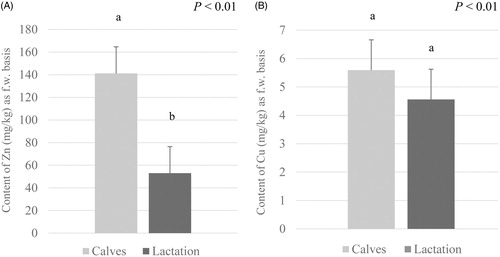
Figure 6. The average concentration of Zn content (A) and Cu content (B) in faeces (mg/kg of f.w. – fresh weight) from different cattle phases (calves, lactation) in considered cattle farms (F5–F8) located in northern Italy. The average humidity content (% as f.w.) in cattle faeces (with SE): 80.03 ± 3.12 for calves; 85.80 ± 0.25 for lactation. Data are presented as least-squares means and SEM.