
Figures & data
Figure 1. Scheduled time points, expressed as days from calving (DFC), for the administration of a monensin controlled-release capsule and its expected release (TRT; the solid line indicates an average administration time, and the dotted line indicates the standard deviation in comparison with the real calving time), rumination time measurement (RUM), milk yield measurement (MY), body condition score determination (BCS), body weight measurement (BW), milk sample collection for analysis of composition and rheological parameters (MS), blood sample collection for metabolic profile determination and rectal temperature measurement (MP/RT) and rumen sample collection for composition and immunological assays (RS). The dotted rectangle indicates the samples used to determine the baseline for blood samples and rumination time; empty ticks indicate –25, –19, –13, –3, and 3 DFC, respectively.
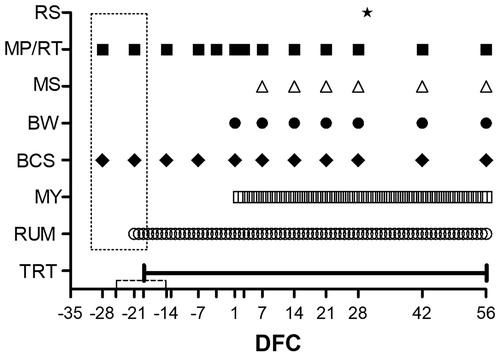
Table 1. Composition and characteristics of the experimental diets fed to cows in dry and lactation periods.
Figure 2. Pattern of rumination time (a) and milk yield (b) in multiparous (ML) and primiparous (PR) cows that received a controlled-release capsule of monensin at –21 days from calving (DFC; Mon) or not (Ctr). t is the time effect; T × P, is the treatment × parity interaction effect; T × t, the treatment × time interaction effect; T × P × t, the treatment × parity × time interaction effect; Ph, the phase (phase durations for the rumination time are Ph1 = from –21 to –6 DFC; Ph2 = from –7 to 0 DFC; Ph3 = from 1 to 7 DFC; Ph4 = from 8 to 21 DFC; Ph5 = from 22 to 35 DFC; Ph6 = from 36 to 49 DFC; and Ph7 = from 50 to 56 DFC. Phase durations for milk yield are Ph1 = from 2 to 13 DFC; Ph2 = from 14 to 27 DFC; Ph3 = from 28 to 41 DFC; and Ph4 = from 42 to 56 DFC); SE is the standard error of the model.
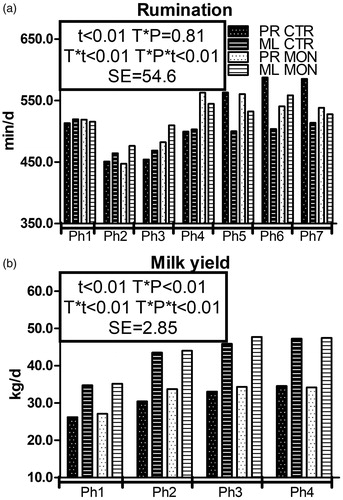
Table 2. Incidence of diseases observed between 1 and 56 days from calving (DFC) in multiparous (ML) and primiparous (PR) cows that received a controlled release capsule of Monensin at –21 DFC (Mon) or not (Ctr).
Figure 3. Pattern of packed cell volume (PCV; a), β-hydroxybutyrate (BHB; b), nonesterified fatty acids (NEFA; c), creatinine (d), urea (e), and sodium (Na; f) in multiparous (ML) and primiparous (PR) cows that received a controlled-release capsule of monensin at –21 days from calving (DFC; Mon) or not (Ctr). Comparisons at each time point were indicated with different symbols for the treatment × time interaction (T × t; *p < .05) and letters for the treatment × parity × time interaction (T × P × t; “a” is p < .1, and “A” is p < .05 for PR cows; “b” is p < .1, and “B” is p < .05 for ML cows); t is the time effect and SE is the standard error of the model.
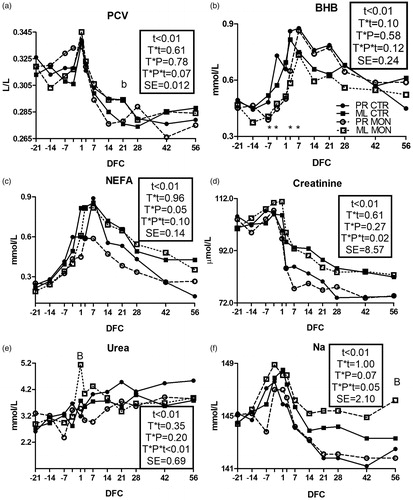
Figure 4. Pattern of ceruloplasmin (CuCp; a), total protein (b), albumin (c), globulin (d), cholesterol (e), paraoxonase (PON; f), myeloperoxidase (MPO; g); gamma glutamyl transferase (GGT; h) and total reactive oxygen metabolites (ROMt; i) in multiparous (ML) and primiparous (PR) cows that received a controlled-release capsule of monensin at –21 days from calving (DFC; Mon) or not (Ctr). Comparisons at each time point were indicated with different letters for the treatment × parity × time interaction (T × P × t; “a” is p < .1, and “A” is p < .05 for PR cows; “b” is p < .1, and “B” is p < .05 for ML cows); t is the time effect and SE is the standard error of the model.
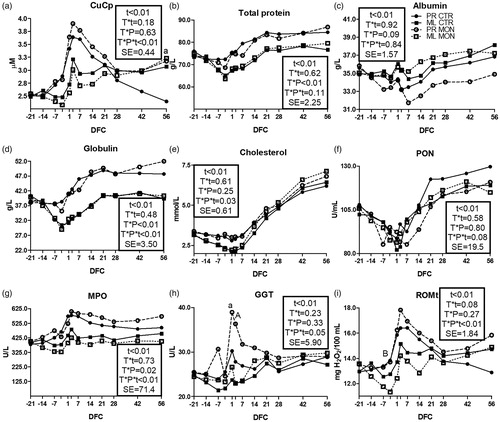
Table 3. Mean milk composition and rheological parameters in multiparous (ML) and primiparous (PR) cows that received a controlled release capsule of monensin at –21 days from calving (DFC; Mon) or not (Ctr).
Table 4. Ruminal pH, ammonia, VFA concentration, VFA molar proportion, and immunological parameters determined 30 days after calving, in multiparous and primiparous cows that received (Mon) or not (Ctrl) a controlled release capsule of monensin at –21 days from calving.