Figures & data
Figure 1. Average number of melanophores in the sea trout (Salmo trutta trutta) newly hatched embryos in geomagnetic field (control) and in static magnetic field of 1, 3 and 5 mT; ANOVA F = 3.9468, p = .01478.
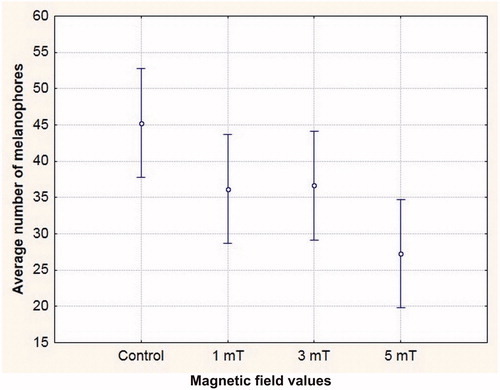
Figure 2. Melanophore index in the head region of newly hatched sea trout (Salmo trutta trutta) embryos in geomagnetic field (control) and in static magnetic field of 1, 3 and 5mT; ANOVA F = 40.134, p = .0000.
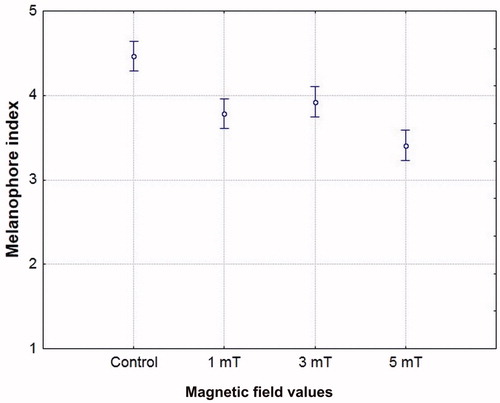
Figure 3. Melanophores in sea trout larvae (Salmo trutta m. trutta) (a – geomagnetic field, b – static, generated magnetic field of 1 mT; 1 – head region, 2 – trunk region).
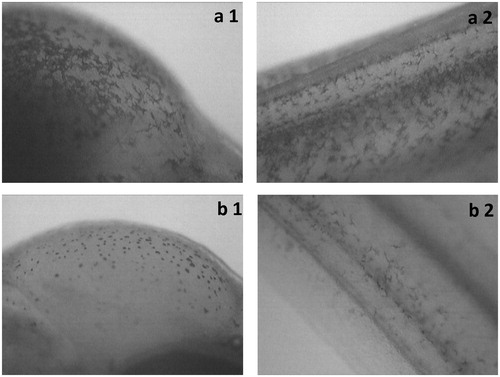
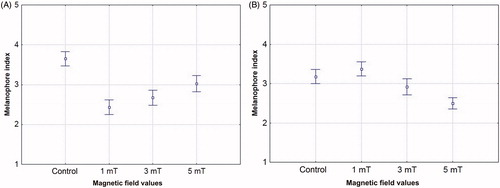
Figure 4. Melanophore index in sea trout larvae (Salmo trutta trutta) under geomagnetic field (control) and under static magnetic field of 1, 3 and 5 mT. A – head region – ANOVA F = 30.588, p = .0000; B –trunk region – ANOVA F = 17.541, p = .00000.