Figures & data
Table 1. Effects of unfractionated CTs F0 and CT fractions of different MWs on the biomass of rumen fungi at 24 h of incubation using in vitro gas production method, estimated using real-time PCR.
Figure 1. Rarefaction curves of rumen fungal communities based on the ITS-1 gene sequences from the different treatment groups. Control (without CTs), (F0 = unfractioned CTs, F1 = Fractrion 1, F2 = Fraction 2, F3 = Fraction 3, F4 = Fraction 4 and F5 = Fraction 5) examined at a 0.03 distance level. The operational taxonomic units (OTUs) were defined by the average neighbour algorithms with 3% dissimilarity using Mothur.
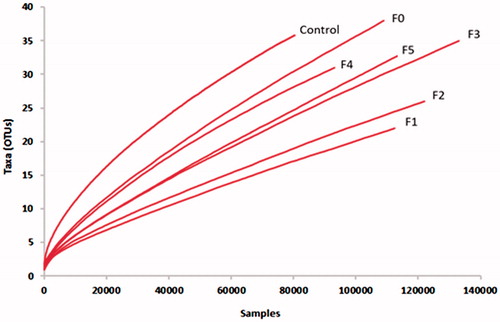
Table 2. Summary of the Illumina MiSeq sequences data and statistical analysis of rumen fungi diversity in bovine rumen fluid without (control) and with unfractionated CTs F0 and CT fractions of different MWs weights from LLR.
Table 3. Relative abundance (% of total sequences) of fungal genera in bovine rumen samples without (control) and with unfractionated CTs F0 and CT fractions of different MWs weights from LLR.
Figure 2. Hierarchical clustering of fungal communities using the Bray-Curtis similarity index based on the un-weighted UniFrac method. Control (without CTs), (F0 = unfractioned CTs, F1 = Fractrion 1, F2 = Fraction 2, F3 = Fraction 3, F4 = Fraction 4 and F5 = Fraction 5). The scale represents the un-weighted UniFrac distances.
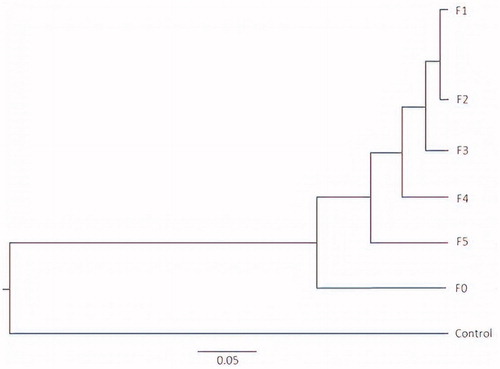
Figure 3. Principal component analysis (PCoA) of fungal ITS-1 gene sequence tags generated from an Illumina MiSeq sequencing run (F0 = unfractionated CT, F1= Fraction F1, F2= Fraction F2, F3= Fraction F3, F4= Fraction F4, and F5= Fraction F5). Percentage of the diversity distribution explained by each axis is indicated on the figure. CT: condensed tannin.
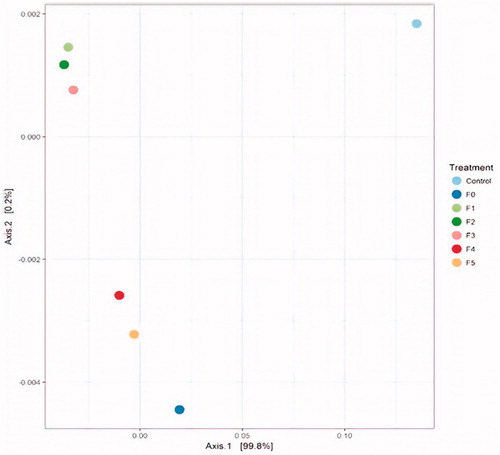
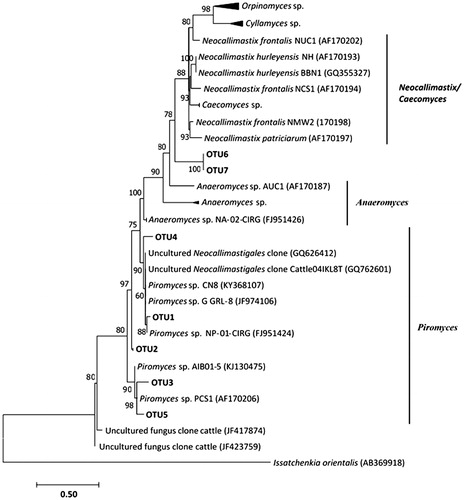
Figure 4. Distance dendogram highlighting the phylogenetic affiliation of anaerobic rumen fungal sequences. Sequences used in the tree construction include available ITS-1 reference gene sequences from GenBank (http://www.ncbi.nlm.nih.gov/BLAST/) and representative OTUs affiliated with known anaerobic fungal genera encountered in this study. The tree was constructed using neighbour-joining algorithm with the Hasegawa–Kishino–Yano (HKY) substitution model and a γ-shaped distribution of 2.0. Bootstrap values are based on 1000 replicates and are shown for branches with >50% bootstrap support. The corresponding ITS-1 region of the ascomycetous yeast Issatchenikia orientalis was used as an outgroup.