Figures & data
Table 1. Descriptive statistics of body weight and body measures in Cornigliese sheep breed.
Table 2. Phenotypic correlation coefficients among body weight and body measures in Cornigliese sheep breed.
Table 3. Multiple regression coefficients for body weight (kg) estimation from body measures (cm) in Cornigliese sheep breed.
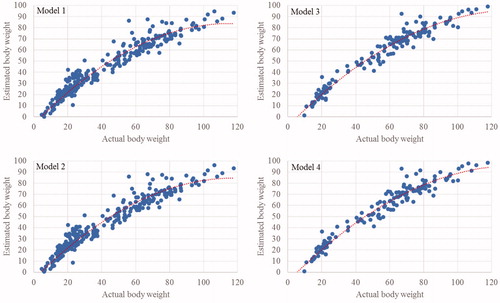
Figure 1. Actual body weight vs. estimated body weight. Model 1: the underlying regression equation is: y = –0.0068x2 + 1.5643x – 6.7174; R2 = 0.944. Model 2: the underlying regression equation is: y = –0.0065x2 + 1.5373x – 6.3193; R2 = 0.940. Model 3: the underlying regression equation is: y = –0.0058x2 + 1.5527x – 8.5986; R2 = 0.961. Model 4: the underlying regression equation is: y = –0.0057x2 + 1.5380x – 8.2466; R2 = 0.958.