
Figures & data
Table 1. Composition and characteristics of the experimental diets fed during the two experimental phases.
Figure 1. Scheduled time point, expressed as day from dry off (DFD), for dry matter intake and rumination time measurement (DMI-RT), body weight and body condition score determination, white blood cells profiling, whole blood stimulation assay and carrageenan skin test performance (BW-BCS-WBC-WBA-CST), haematic metabolic profile (MP), interferon gamma release assay (IFNG).
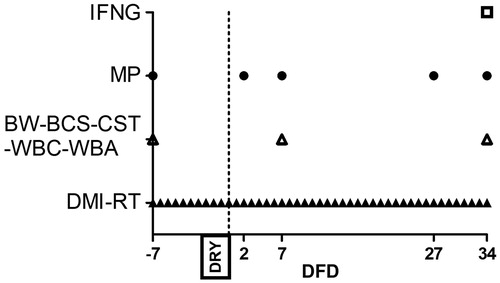
Figure 2. Pattern of dry matter intake (a) and rumination time (b) in dairy cows with an average milk production lower (LM; solid line) or higher than 15 L·d−1 (HM; dotted line) in the week prior to dry off. MD is the effect of milk yield at dry off; t is time effect (**p < .01); MD × t is the interaction effect (A/B is p < .01); WFD is weeks from dry off; DRY is dry-off day (−55 days from expected calving).
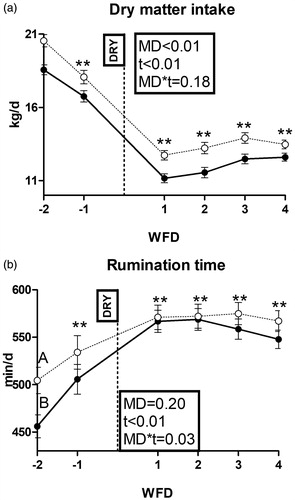
Figure 3. Time course of packed cell volume (a) and plasma concentrations of NEFA (b), β-hydroxybutyrate (c), l-lactic acid (d), d-lactic acid (e), creatinine (f), urea (g), calcium (h) and magnesium (i) in dairy cows with an average milk production lower (LM; solid line) or higher than 15 L·d−1 (HM; dotted line) in the week prior to dry-off. MD is the effect of milk yield at dry-off; t is time effect (**p < .01; *p < .05; †p < .1); MD × t is the interaction effect (A/B is p < .01); DFD is days from dry-off; DRY is dry-off day (−55 days from expected calving); Log indicates data expressed as log-transformed.
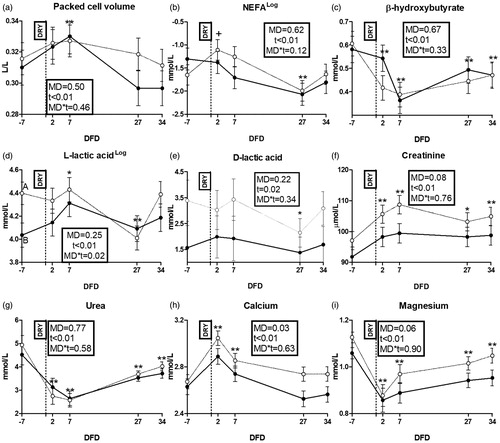
Figure 4. Time course of plasma concentrations of phosphorus (a); potassium (b), chlorine (c), zinc (d), γ-glutamyl transferase (e), bilirubin (f), alkaline phosphatase (g), protein (h) and globulin (i) in dairy cows with an average milk production lower (LM; solid line) or higher than 15 L·d−1 (HM; dotted line) in the week prior to dry-off. MD is the effect of milk yield at dry-off; t is time effect (**p < .01; *p < .05; †p < .1); MD × t is the interaction effect; DFD is days from dry-off; DRY is dry-off day (−55 days from expected calving).
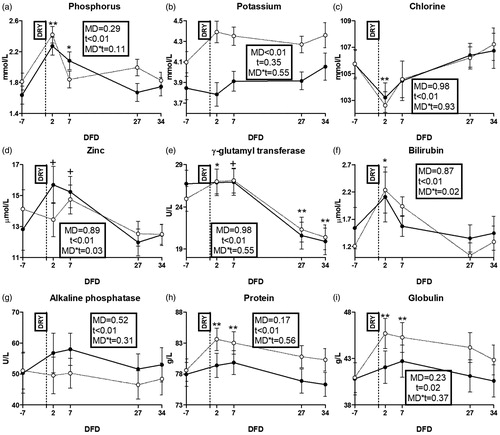
Figure 5. Time course of plasma concentrations of haptoglobin (a); ceruloplasmin (b); serum amyloid-α (c), albumin (d), retinol (e), paraoxonase (f), cholesterol (g), interleukin-1 (h) and thiol groups (i) in dairy cows with an average milk production lower (LM; solid line) or higher than 15 L·d−1 (HM; dotted line) in the week prior to dry-off. MD is the effect of milk yield at dry-off; t is time effect (**p < .01; *p < .05; †p < .1); MD × t is the interaction effect; DFD is days from dry-off; DRY is dry-off day (−55 days from expected calving); Log indicates data expressed as log-transformed.
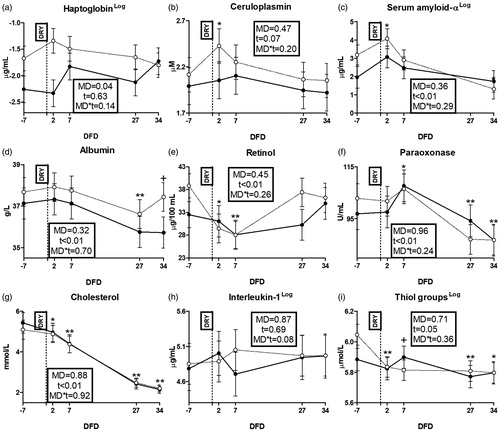
Figure 6. Time course of plasma concentrations of ferric reducing antioxidant power (FRAP; a); tocopherol (b), β-carotene (c), oxygen reactive antioxidant power (ORAC; d), advanced oxidation protein product (AOPP; e), nitrite (f), nitrate (g) and nitric oxide (h) in dairy cows with an average milk production lower (LM; solid line) or higher than 15 L·d−1 (HM; dotted line) in the week prior to dry-off. MD is the effect of milk yield at dry-off; t is the time effect (**p < .01; *p < .05; †p < .1); MD × t is the interaction effect (a/b is p < .05; a/b is p < .1); DFD is days from dry-off; DRY is dry-off day (−55 days from expected calving); Log indicates data expressed as log-transformed.
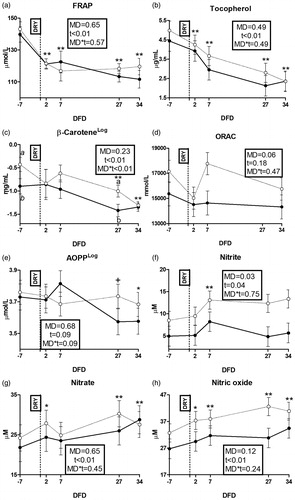
Table 2. White blood cells profile in dairy cows with an average milk production lower (LM) or higher (HM) than 15 L·d−1 in the week prior to dry-off.
Table 3. Fold changes of cytokines after a whole blood stimulation assay with a low (L) or high (H) dose of bacterial lipopolysaccharides (LPS) in dairy cows with an average milk production lower (LM) or higher (HM) than 15 L·d−1 in the week prior to dry-off.
Table 4. Fold changes of glucose and metabolites thereof after a whole blood stimulation assay with a low (L) or high (H) dose of bacterial lipopolysaccharides (LPS) in dairy cows with an average milk production lower (LM) or higher (HM) than 15 L·d−1 in the week prior to dry-off.
Table 5. Fold changes of nitrite, nitrate and nitric oxides after a whole blood stimulation assay with a low (L) or high (H) dose of bacterial lipopolysaccharides (LPS) in dairy cows with an average milk production lower (LM) or higher (HM) than 15 L·d−1 in the week prior to dry-off.