
Figures & data
Figure 1. Relationship between estimated bacteria counts and frequency of positive BTM (1,2,3). The frequency of positive results among each pathogens have a statistically significant trend at Cochrane-Armitage test (p < .0001). BTM: bulk tank milk.
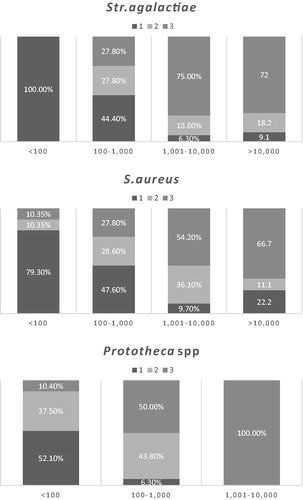
Table 1. Prevalence of positive bulk tank milk samples for the four bacteria species considered.
Table 2. Analysis of variance of the GLM model applied to assess the role of the factors considered on SCC and milk yield.
Table 3. Results of contrast analysis related to the three main factors considered for SCC and milk yield.
Table 4. Results of contrast analysis related to the interaction of BTM results and herd size and for SCC and milk yield.
Table 5. Odds ratio (confidence limits 95%) for risk factors associated to the presence of the four pathogens considered in BTM.