
Figures & data
Figure 1. Number of records and mean weights of local kids at given period.
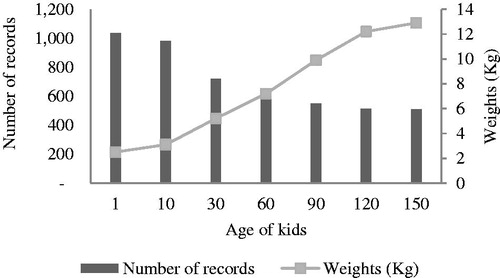
Table 1. Percentage of growth records from weekly recording which coincide with an exact standard age.
Table 2. Descriptive statistics for traits studied at standard ages and for estimates from simplified recording schemes.
Table 3. Descriptive statistics for traits studied at standard ages and for estimates from simplified recording schemes when birth weight is missing.
Table 4. Test of significance of environmental factors and interactions on W10 with the presence of birth weight.
Table 5. Test of significance of environmental factors and interactions on W60 with the presence of birth weight.
Table 6. Test of significance of environmental factors and interactions on W10 with the lack of birth weight.
Figure 2. Direct heritability estimates using weights at standard ages and alternative weekly recording schemes.
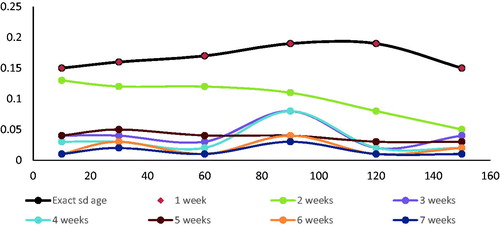
Figure 3. Maternal heritability estimates using weights at standard ages and alternative weekly recording schemes.
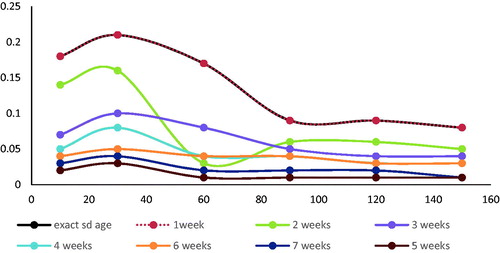
Figure 4. Genetic correlations between weights obtained with records taken at exact standard ages.
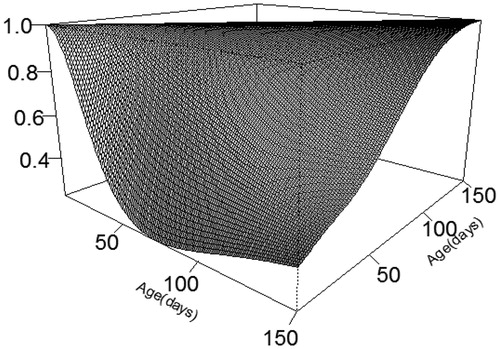
Table 7. Genetic correlations of weight traits estimated with the simplified weights recording method.