Figures & data
Table 1. List of primer pairs used for construction of promoter, 5′ flanking sequence clone, real-time PCR and bisulfite sequencing PCR.
Figure 1. The intramuscular fat (IMF) content was determined in 168 longissimus dorsi (LD) muscles. The lowest IMF (LEAN) and highest IMF (FAT) were selected (Mean ± SE, n = 12 in each group), **p<.01.
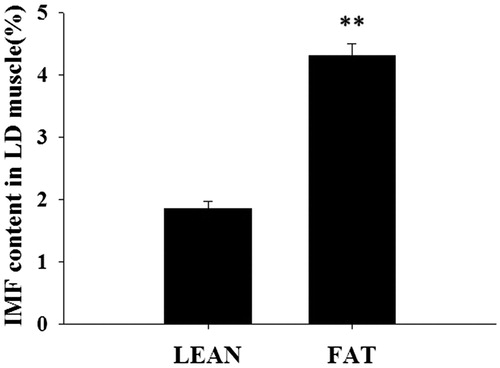
Figure 2. Relative expression of the pADRP gene in longissimus dorsi (LD) muscles divergent for intramuscular fat content. The data are shown as Mean ± SD, n = 12 in each group, **p<.01.
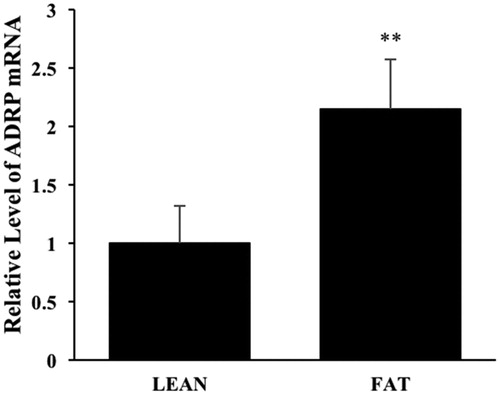
Figure 3. Representative gel photograph of PCR-amplified fragments. (a) Representative gel photograph of PCR-amplified pADRP gene 5′ flanking sequence. (b) Representative gel photograph of BSP analyses using bisulphite-treated DNA. 1: LEAN group; 2: FAT group.
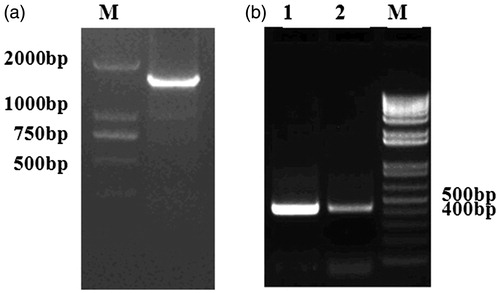
Figure 4. Characterisation of pADRP gene 5′ flanking sequences. Sequences with double underscores and dashed underline represented two CpG islands in the promoter of the pADRP gene region, respectively. Observed/Expected ratio >0.60; the length of CpG islands >200 bp. CpG sites are highlighted in grey. Transcription factor binding sites analysed using TESS are indicated above the sequences.
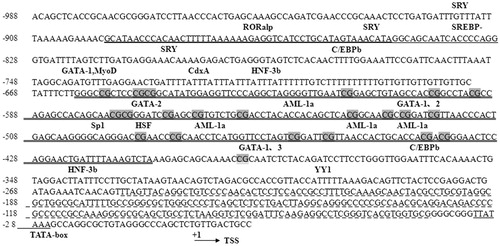
Figure 5. Scanning deletion analyses of pADRP promoters in PK cell line. The top panel illustrated the porcine ADRP gene structure. The left side of the diagram illustrated the constructs consisting of the different promoter regions fused upstream of a luciferase reporter, and the right illustrated the relative luciferase activity.
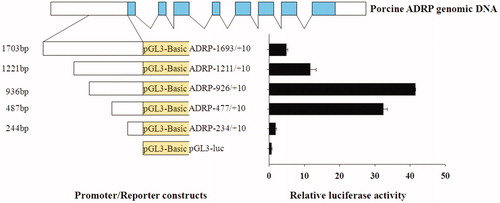
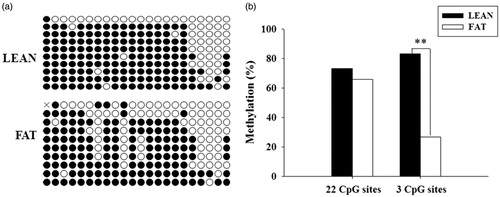
Figure 6. Methylation status of the pADRP promoter in LEAN group and FAT group LD muscles. (a) Bisulphite sequencing results for LEAN group and FAT group. Each level line represented an individually sequenced clone and circles represented CpG residues. White circles indicated unmethylated CpG sites; black circles represented methylated CpG sites. (b) The histogram of methylation level. **p<.01.