Figures & data
Table 1. Sequences of bta-miR-145 mimic, mimic NC, inhibitor and inhibitor NC.
Table 2. Primers for microRNA reverse transcription and real-time qPCR analysis.
Figure 1. Cells images without or with bta-miR-145 transfection under fluorescence microscopy. (A) Bovine mammary epithelial cells without transfection (10 × 10). (B) Bovine mammary epithelial cells with bta-miR-145 mimic-FAM transfection(10 × 10). (C) Bovine mammary epithelial cells with bta-miR-145 inhibitor-FAM transfection (10 × 10).
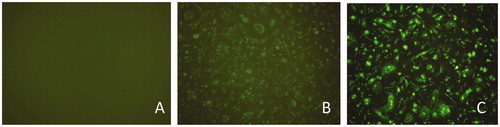
Figure 2. The bta-miR-145 overexpression and inhibition. Overexpression effect is caused by transfecting 150 pmol bta-miR-145 mimic. Inhibition effect is caused by transfecting 300 pmol bta-miR-145 inhibitor. The same as in Figures .
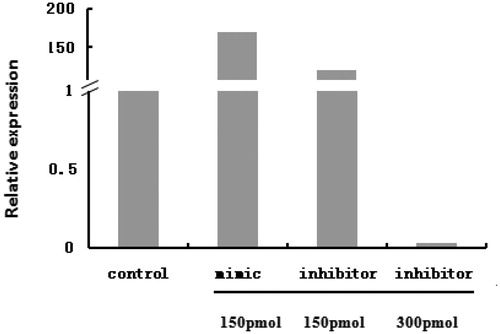
Figure 3. The effect of bta-miR-145 overexpression and inhibition on the cells proliferation. Optical density value indicates the number of live cells. NC means negative control. (A) Overexpression of bta-miR-145 significantly decreases the proliferation of mammary epithelial cells (p < .05). (B) Inhibition of bta-miR-145 significantly increases the proliferation of mammary epithelial cells (p < .05). * indicate significant differences at levels of p < .05.
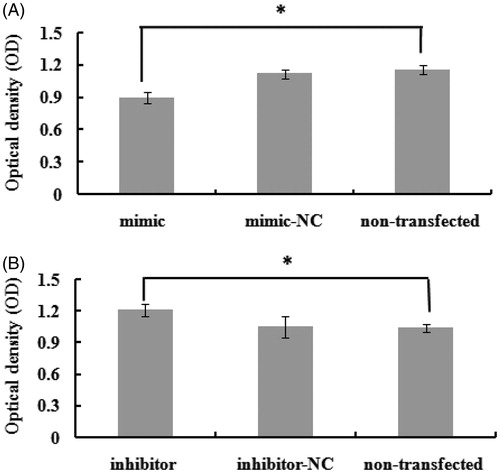
Figure 4. Phylogenetic tree of bta-mir-145. The bovine, human, mouse, rabbit and swine miR-145 precursor were selected. Bta-mir-145 and bta-mir-143 are in the same cluster.
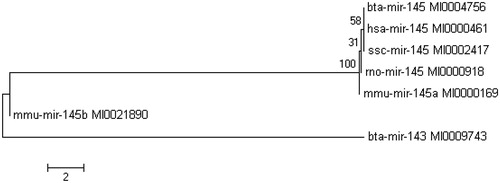
Figure 5. Two major signalling pathways related to IRS1.
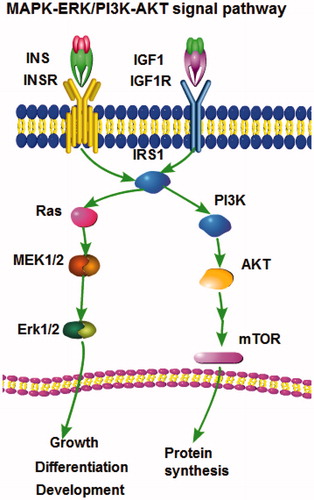
Table 3. Signalling pathway of bta-miR-145.
Figure 6. The two probable binding sites on the bovine IRS1 3’UTR for bta-miR-145. Matching bases were displayed with shadow.
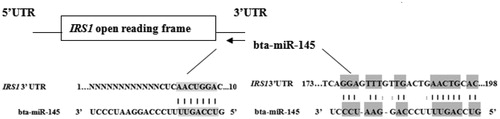
Table 4. The minimum free energy and the secondary structure of the binding sites.
Figure 7. The effect of bta-miR-145 overexpression or inhibition on IRS1 mRNA level. No significant change for IRS1 mRNA expression appeared after bta-miR-145 mimic or inhibitor transfection (p > .05).
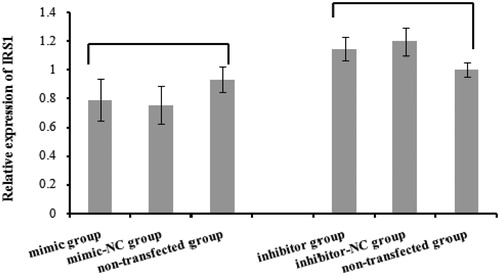
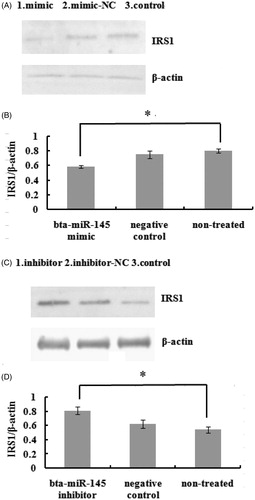
Figure 8. Protein greyscale scanning and statistical results of IRS1 by Western blotting. A and C respectively show IRS1 immunoblot in pBMECs after 72 h of transfect with the miR-145 mimic or inhibitor. B and D, respectively, show statistical result of protein relative expression levels. Protein expression was normalised to β-actin. * indicate significant differences at levels of p < .05.