
Figures & data
Table 1. Primers used in the qPCR analysis.
Table 2. Summary of reads mapping to the bovine transcriptomes.
Figure 1. Profile of lncRNA characteristics. (a) Summary of lncRNA types (b) The number of lncRNAs detected on each chromosome (c) The length distribution of lncRNAs (d) Exon number distribution of lncRNAs.
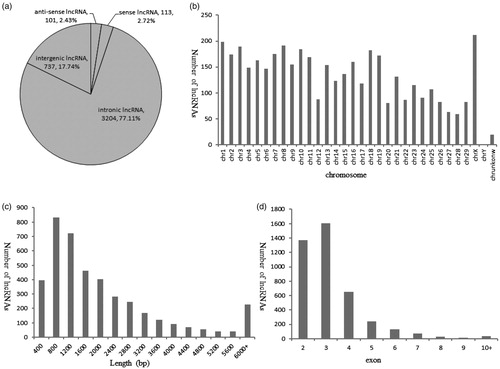
Figure 2. Analyses of differentially expressed lncRNAs between Charolais cattle and Tongjiang cattle. (a) Venn diagram of expressing lncRNAs in both CH and TJ breeds (b) PCA score plot of six samples. CH: Charolais; TJ: Tongjiang.
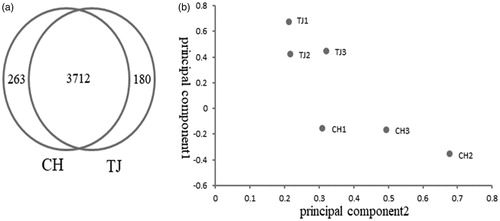
Table 3. The GO term and KEGG functional annotation of genes nearby lncRNAs.
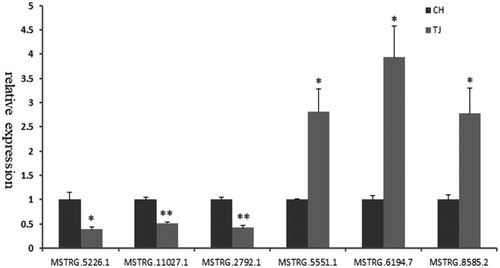
Figure 3. Validation of six differentially expressed lncRNAs by qPCR. Data are the mean ± SEM. *p<.05; **p<.01.
Supplemental material