
Figures & data
Table 1. Composition and nutrient levels of the basal diet (as-fed basis), %.
Table 2. Primer sequences and parameter.
Table 3. Total phenolic and flavonoid contents and in vitro antioxidant capacities of AAE.
Figure 1. Effect of AAE on average daily body weight gain (ADG) of broilers. Note: AAE = Artemisia annua L. aqueous extract; CON: control; AAE500: 500 mg/kg AAE; AAE1000: 1000 mg/kg AAE; AAE1500: 1500 mg/kg AAE; AAE2000: 2000 mg/kg AAE; CTC: chlortetracycline. Results are presented as mean ± standard deviation (n = 5). a,b,cDifferent capital letters indicate significant differences between groups in the same period (p<.05). Dose-dependent effects of AAE are shown on the right of each figure (Lin: linear; Qua: quadratic).
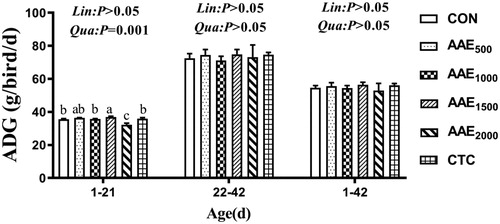
Figure 2. Effect of AAE on average daily feed intake (ADFI) of broilers. Note: AAE = Artemisia annua L. aqueous extract; CON: control; AAE500: 500 mg/kg AAE; AAE1000: 1000 mg/kg AAE; AAE1500: 1500 mg/kg AAE; AAE2000: 2000 mg/kg AAE; CTC: chlortetracycline. Results are presented as mean ± standard deviation (n = 5). a,bDifferent capital letters indicate significant differences between groups in the same period (p<.05). Dose-dependent effects of AAE are shown on the right of each figure (Lin: linear; Qua: quadratic).
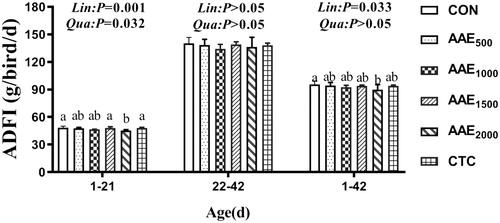
Figure 3. Effect of AAE on feed conversion ratio (FCR) of broilers. Note: AAE = Artemisia annua L. aqueous extract; CON: control; AAE500: 500 mg/kg AAE; AAE1000: 1000 mg/kg AAE; AAE1500: 1500 mg/kg AAE; AAE2000: 2000 mg/kg AAE; CTC: chlortetracycline. Results are presented as mean ± standard deviation (n = 5). a,bDifferent capital letters indicate significant differences between groups in the same period (p<.05). Dose-dependent effects of AAE are shown on the right of each figure (Lin: linear; Qua: quadratic).
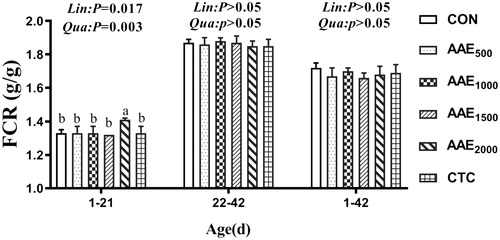
Table 4. Effect of AAE on serum antioxidant capacity in broilers.
Table 5. Effect of AAE on hepatic antioxidant capacity in broilers.
Table 6. Effect of AAE on spleen antioxidant capacity in broilers.
Table 7. Effect of AAE on relative mRNA expression in liver of broilers.
Table 8. Effect of AAE on relative mRNA expression in spleen of broilers.