
Figures & data
Table 1. Ingredients of the experimental diets (g/kg as fed).
Table 2. Chemical composition (g/kg, as is basis) of the silkworm chrysalis meal (SWM) and of the experimental diets.
Table 3. Fatty acid profile (% of total FAME) of the of the Bombyx mori pupae meal (SWM) and of the experimental diets.
Figure 1. (a) Effect of the dietary inclusion of 0% (Control), 25% (SWM25) and 50% (SWM50) silkworm meal on the weekly body weight (g) of male chickens. a–cDifferent superscript letters differ for p < .05. A,BDifferent superscript letters differ for p < .01. (b) Effect of the dietary inclusion of 0% (Control), 25% (SWM25) and 50% (SWM50) silkworm meal on the weekly body weight (g) of female chickens. a,bDifferent superscript letters differ for p < .05. A,BDifferent superscript letters differ for p < .01.
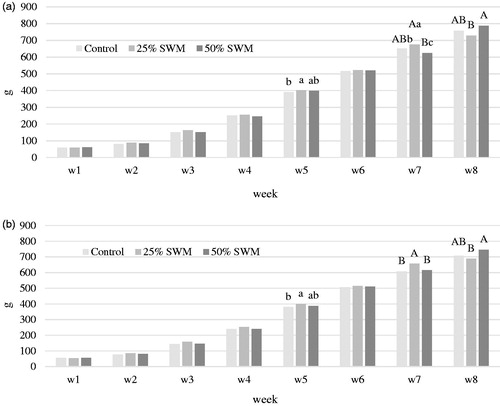
Table 4. Effect of the dietary inclusion of 0% (Control), 25% (SWM25) and 50% (SWM50) silkworm meal on chickens’ daily weight gain (g) for every week of the experiment.
Table 5. Effect of the dietary inclusion of 0% (Control), 25% (SWM25) and 50% (SWM50) silkworm meal on feed intake (FI) and feed convertion rate (FCR) of chickens.
Table 6. Effect of the dietary inclusion of 0% (Control), 25% (SWM25) and 50% (SWM50) silkworm meal on carcase traits, internal organs and breast meat traits of male chickens.
Table 7. Effect of the dietary inclusion of 0% (Control), 25% (SWM25) and 50% (SWM50) silkworm meal on the breast meat proximate composition (g/100 g meat) of male chickens.
Figure 2. Effect of the dietary inclusion of 0% (Control), 25% (SWM25) and 50% (SWM50) silkworm meal on the breast muscle C18:3 n-3 (mg/100 g of meat) of male chickens. a–cDifferent superscript letters differ for p < .05. *C18:3 n-3: 6.75 versus 15.0 versus 28.4 mg/100 g meat for Control, SWM25 and SWM50 treatments, respectively.
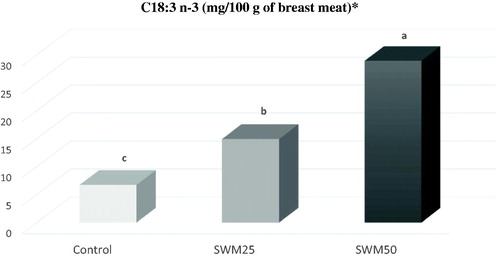
Table 8. Effect of the dietary inclusion of 0% (Control), 25% (SWM25) and 50% (SWM50) silkworm meal on the breast meat fatty acid profile (% of total FAME) of male chickens.