Figures & data
Table 1. Blood plasma parameters and cortisol levels in rainbow trout reared at 8 °C or 12 °C and stunned by asphyxia with CO (CO) or electricity (E) (n = 5 fish/experimental group).
Table 2. Results of the significant interaction (stunning × temperature, S × T) emerged for K+ (mM) plasma content.
Table 3. ATP contents, AEC values, and fillets shape changes immediately post mortem in muscle of rainbow trout reared at 8 °C or 12 °C and stunned/slaughtered by asphyxia with CO (CO) or electricity (E) (n = 3 fish/experimental group).
Table 4. Results of the significant interaction (stunning × temperature, S × T) emerged for AEC values determined immediately post mortem (T0) in muscle of rainbow trout reared at 8 °C or 12 °C and stunned by asphyxia with CO (CO) or electricity (E).
Figure 1. Post mortem evolution of rainbow trout pH as affected by rearing water temperature [8 °C, (A); 12 °C, (B)], and stunning methods (asphyxia with CO, CO; electricity, E). Values are presented as means (n = 5 fish/experimental group). Vertical bars indicate the standard deviation.
![Figure 1. Post mortem evolution of rainbow trout pH as affected by rearing water temperature [8 °C, (A); 12 °C, (B)], and stunning methods (asphyxia with CO, CO; electricity, E). Values are presented as means (n = 5 fish/experimental group). Vertical bars indicate the standard deviation.](/cms/asset/87f1071e-6a34-4080-994d-f83d186a5c72/tjas_a_1759465_f0001_b.jpg)
Figure 2. Post mortem evolution of rainbow trout Rigor Index (RI, %) as affected by rearing water temperature [8 °C, (A); 12 °C, (B)], and stunning methods (asphyxia with CO, CO; electricity, E). Values are presented as means (n = 5 fish/experimental group). Vertical bars indicate the standard deviation.
![Figure 2. Post mortem evolution of rainbow trout Rigor Index (RI, %) as affected by rearing water temperature [8 °C, (A); 12 °C, (B)], and stunning methods (asphyxia with CO, CO; electricity, E). Values are presented as means (n = 5 fish/experimental group). Vertical bars indicate the standard deviation.](/cms/asset/bc2b33a0-9f1a-4b14-b812-4c17b7a60423/tjas_a_1759465_f0002_b.jpg)
Figure 3. Effect of asphyxia with CO (CO) or electricity (E) stunning methods on perimeter, area, maximum length and maximum width in fillets of rainbow trout, measured at different times after death, expressed as percentage of the value measured immediately after death (n = 3 fish/experimental group).
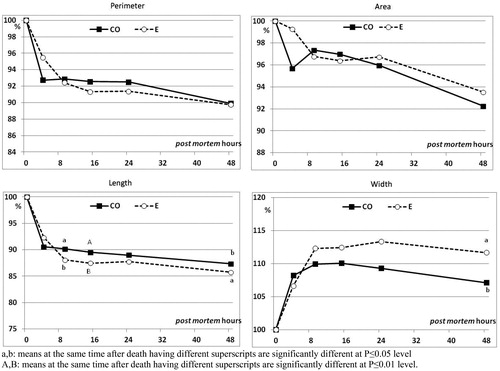
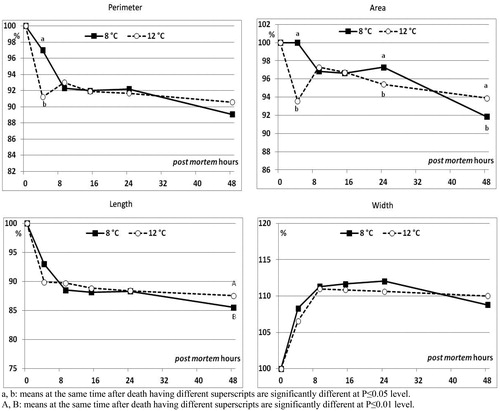
Figure 4. Effect of rearing temperature (water set at 8 or 12 °C) on perimeter, area, maximum length and maximum width in fillets of rainbow trout, measured at different times after death, expressed as percentage of the value measured immediately after death (n = 3 fish/experimental group).