Figures & data
Table 1. Medians, the first (Q1) and third (Q3) quartiles of bibliometric indices and index ratios calculated for a single academic position and for all ASPA academic members.
Figure 1. ASPA scientific community divided by the scientific disciplinary sector (S.D.S.). Scatterplot of the number of papers published by each member plotted against total citations (Cit. tot (1), on the left) and H(1) (on the right) indices and the relative position to medians (red scattered lines).
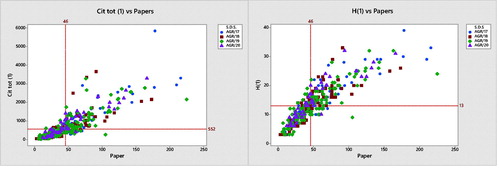
Table 2. Pearson correlations between some of the bibliometric indices and index ratios calculated for all ASPA academic members.
Figure 2. ASPA scientific community divided by academic role. Scatterplot of the number of papers published by each member plotted against mean author per paper (co_aut_paper, on the left) and % of total citations exclude self-citations (%self_cit_aut(3), on the right) indices and the relative position to medians (red scattered lines).
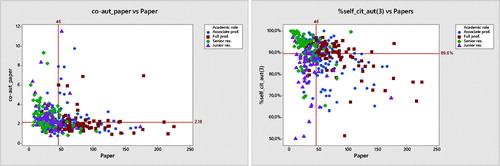
Figure 3. ASPA scientific community divided by academic role. Scatterplot of the number of total citations (Cit tot (1)) by each member plotted against mean author per paper (co_aut_paper, on the left) and % of total citations excluded self-citations (%self_cit_aut(3), on the right) indices and the relative position to medians (red scattered lines).
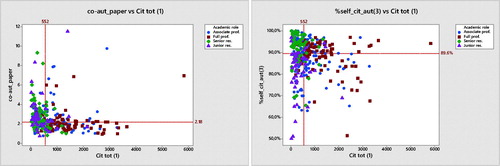
Figure 4. ASPA scientific community divided by academic role. Scatterplot of % total citations excluded self-citations (%self_cit_aut(3)) by each member plotted against H-index excluded self-citations (H(3), on the left) and average citations per co-author(cit/aut_all, on the right) indices and the relative position to medians (red scattered lines).
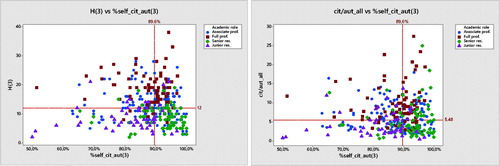
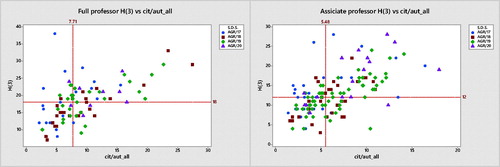
Figure 5. Full and Associate professors, members of ASPA, divided by scientific area (S.D.S.). Scatterplots of H-index excluded self-citations (H(3)) against average citations per co-authors.