
Figures & data
Table 1. Estimates of genetic parameters for reproductive traits in Limousine and Charolais cattle raised in Italy.
Figure 1. Phenotypic trends for age at first calving (A) and calving intervals (B) in Limousine and Charolais cattle raised in Italy.
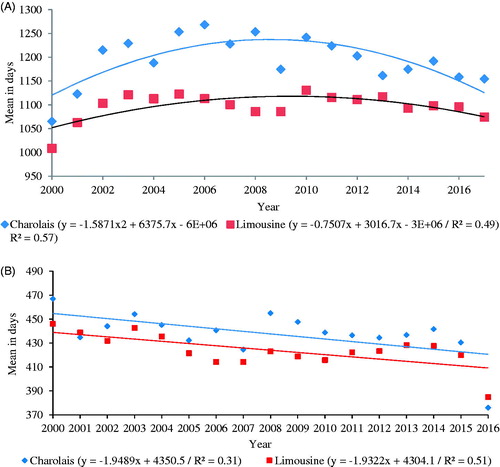
Figure 2. Genetic trends for age at first calving (A) and calving interval (B) in Limousine and Charolais cattle raised in Italy.
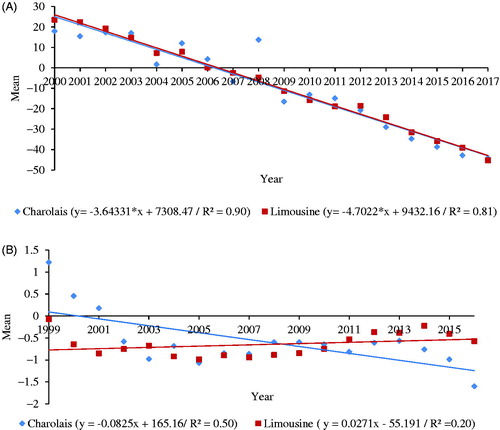
Figure 3. Number of breeders, average number of calves per breeder and effective size, at intervals of 6 years, from 1960 to 2013 for Charolais (A) and Limousine (B) cattle raised in Italy. Ne: effective size.
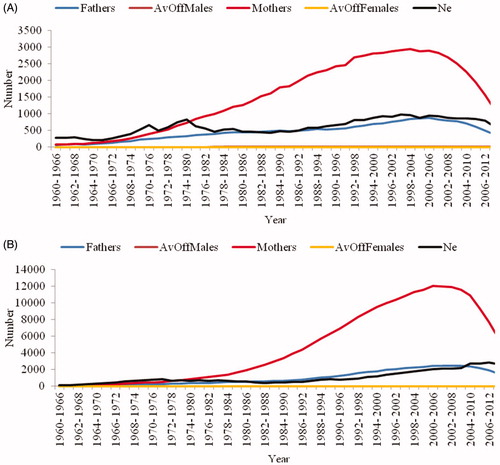
Table 2. Classification of registered herds of Limousine and Charolais cattle raised in Italy, according to the use and origin of bulls.
Figure 4. Percentage of ancestors known in the first ten generations in the herd of Limousine and Charolais.
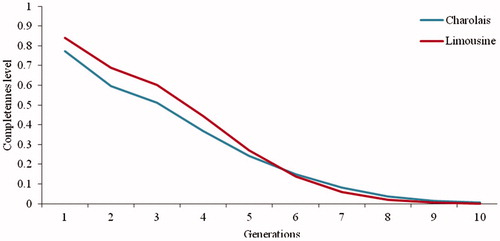
Table 3. Population parameters of Limousine and Charolais cattle raised in Italy.
Table 4. Average number of traced generations (ANTG), inbreeding increase (ΔF) and effective size (Ne) by generation type in Charolais and Limousine cattle.
Table 5. Average inbreeding coefficient (F%), percentage of inbred individuals (Inb%), mean F for inbred animals (FInb%), mean ratio coefficient (AR%) and effective size (Ne).