Figures & data
Table 1. Ingredient composition and analysed nutrient contents of the basal diet [g/kg] (data is based on feed).
Table 2. Effects of LL* supplemental on laying performance of laying hens.◊.
Table 3. Effects of LL* supplemental on egg quality of laying hens ◊.
Figure 1. Principal Component Analysis (PCA) of the community membership using Bray-Curtis distance. CON, control group; LL, group II. The abscissa and ordinate represent the two selected principal components, and the percentage represents the contribution of the principal component to the difference in sample composition. Points of different colours and shapes represent samples of different groups, and the closer the two sample points are, the more similar the composition of the two samples species is.
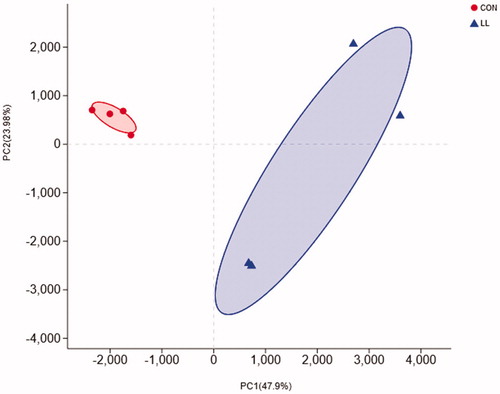
Figure 2. Welch’s t-test bar plot on Phylum level. CON, control group; LL, group II. The ordinate (left) represents the phyla name and the ordinate (right) represents the p-Value.
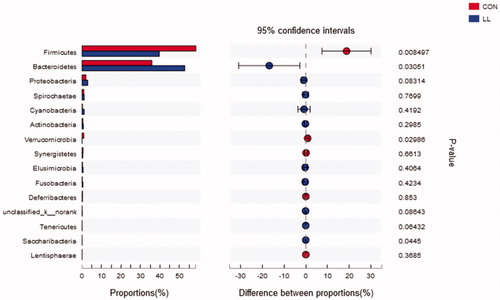
Figure 3. Welch’s t-test bar plot on Family level. CON, control group; LL, group II. The ordinate (left) represents the family name and the ordinate (right) represents the p-Value.
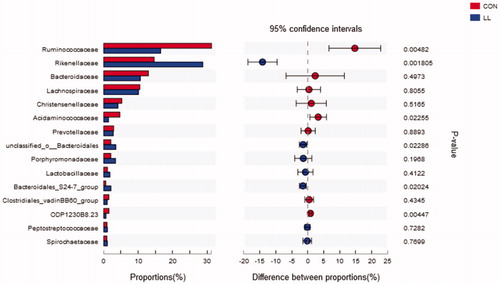
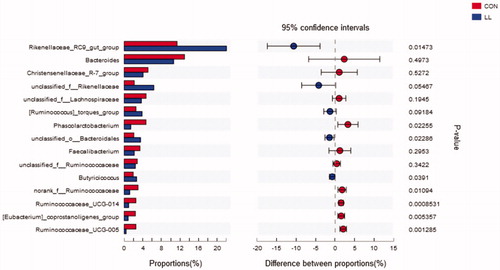
Figure 4. Welch’s t-test bar plot on Genus level. CON, control group; LL, group II. The ordinate (left) represents the genus name and the ordinate (right) represents the p-Value.