Figures & data
Table 1. Mean and standard deviation (SD) of test-day milk yield, composition, somatic cell count (SCC), differential somatic cell count (DSCC) and milk coagulation properties of four cattle breeds.
Table 2. Classification of cow’s udder health status, combining the information of somatic cell count (SCC) and differential somatic cell count (DSCC), according to breed and parity.
Figure 1. Least squares means (with standard errors) of (a) milk yield, (b) protein percentage, (c) fat percentage and (d) lactose percentage according to udder health status classification. Different letters mark statistical significance (p <.01).
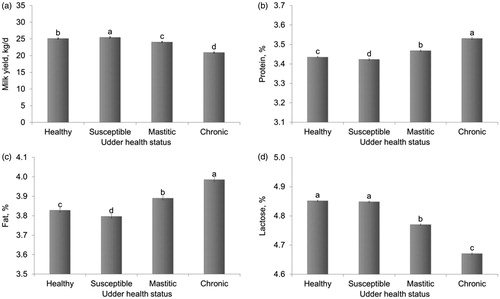
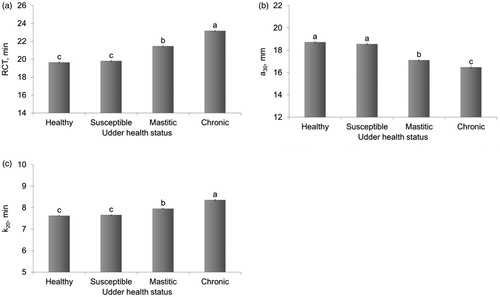
Figure 2. Least squares means (with standard errors) of (a) rennet coagulation time (RCT), (b) curd firmness 30 min after rennet addition to milk (a30), and (c) curd-firming rate to a curd firmness of 20 mm (k20) according to udder health status classification. Different letters mark statistical significance (p<.01).