Figures & data
Table 1. Composition of basal diet fed to chicks.
Table 2. Gene-special primers for Beclin-1, Dynein, ATG-4B, ATG-5, LC3-A, LC3-B and β-actin used in the qPCR.
Figure 1. Effects of Se-deficiency on the weight and male organ coefficient of chicks. (A) body weight, (B) testicle weight and (C) organ coefficient. ***Significant differences (p < .001) between the CK group and the low Se group. ns: no significant differences.
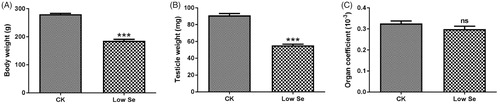
Figure 2. Photomicrographs of chick testis (HE staining). (A) The normal architecture of testis tissue in the control group (400×). (B, C) Testis tissue was injured in the Low Se group (400×). (D) Testis tissue was injured in the low Se group (200×).
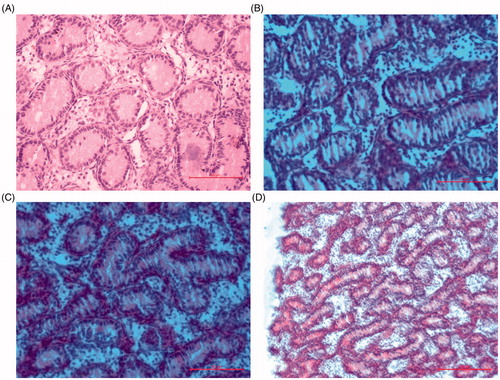
Figure 3. Effects of Se-deficiency on changes of serum sex hormones and antioxidant enzymes. (A) Testosterone, (B) Oestradiol, (C) T-AOC, (D) GSH-ST and (E) GSH-PX. **, ***Significant differences (p < .01, p < .001) between the CK group and the low Se group.
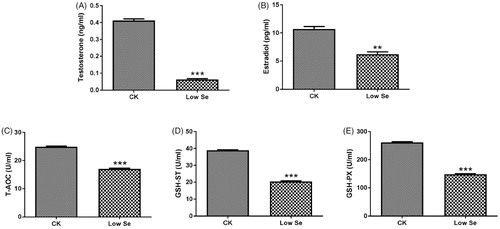
Figure 4. Effects of Se-deficiency on autophagy-related factors mRNA expression in chick testis. The mRNA expression of (A) Beclin1, (B) Dynein, (C) ATG-4B, (D) ATG5, (E) LC3-A and (F) LC3-B genes, respectively. In the experiment, the relative mRNA expression of the autophagy genes was detected by qPCR. *, **Significant differences (p < .05, p < .01) between the CK group and the low-Se group.
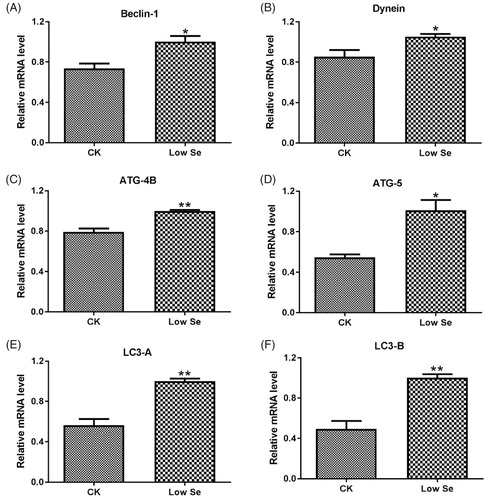
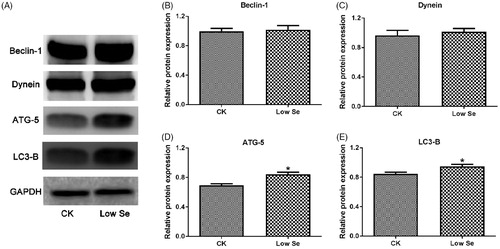
Figure 5. Effects of Se-deficiency on autophagy-related factors protein expression in chick testis. The protein expression of (B) Beclin1, (C) Dynein, (D) ATG5 and (E) LC3-B genes, respectively. In the experiment, the relative protein expression of autophagy genes was detected by western blot. *Significant differences (p < .05) between the CK group and the low Se group.