Figures & data
Table 1. Descriptive statistics (averaged on week basis) for milk yield (kg/d), milk fat, milk protein, Linear Score, body condition score (BCS), temperature humidity index (THI) and group dry matter intake (DMI) (Number of cows = 20).
Table 2. Daily meanTable Footnotea values (averaged on week basis) for standing and lying behaviour patterns (standing time, lying time, lying bout frequency, lying bout duration). (Number of cows = 20, Number of total observations = 432).
Figure 1. Daily lying behaviour pattern in three different stages of lactation (0–14 DIM, 42–56 DIM, 98–112 DIM). DIM: days in milk.
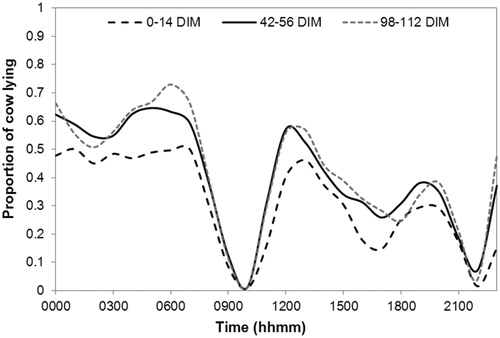
Figure 2. Milk production and Body condition score (BCS) for group of cows with BCS at parturition (<3.25 or >3.25) during the first 40 weeks of lactation.
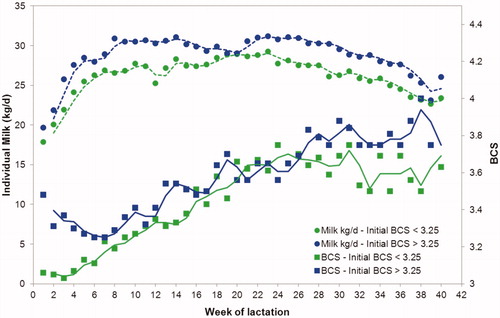
Figure 3. Milk production and Body condition score (BCS) for group of cows with daily time standing in the first 21 days of lactation (<14 or >14 h/d) during the first 40 weeks of lactation.
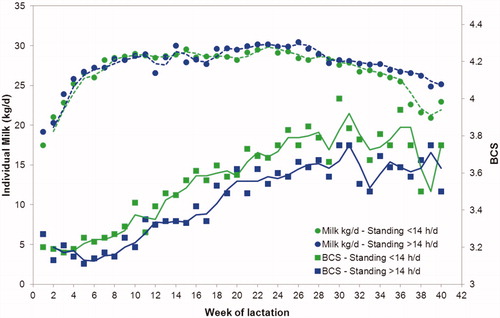
Table 3. Body condition score (BCS) at parturition and daily cow standing time effects on milk production and lying behaviour (Least Square means) (Number of cows = 20).
Figure 4. Standing time (h/d) and number of bouts (n/d) by group of cows differing for the daily time standing (<14 or >14 h/d) in the first 21 days of lactation, during the first 22 weeks of lactation.
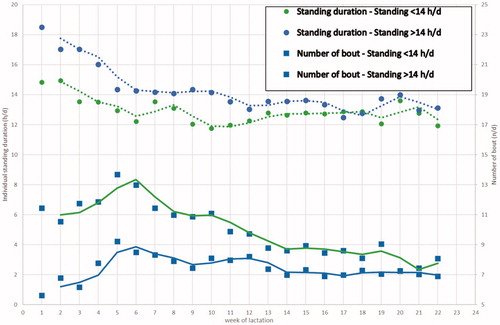
Figure 5. Standing time (h/d) and number of bouts (n/d) for group with Body condition score (BCS) at parturition (<3.25 or >3.25) during the first 22 weeks of lactation.
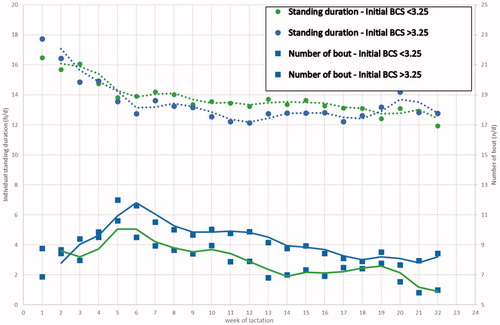
Table 4. Multiple regression on individual milk production (kg/d).
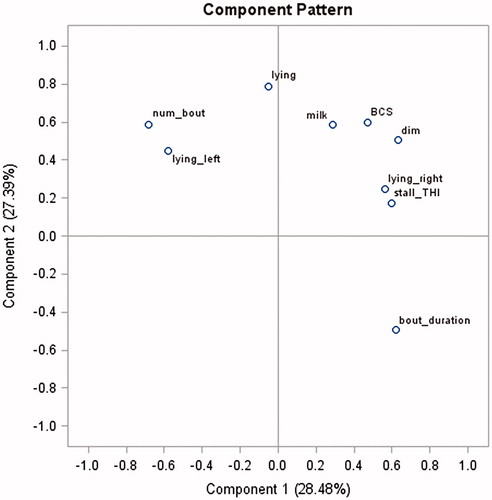
Figure 6. Component Pattern for principal component analysis (PCA).