
Figures & data
Table 1. Nonlinear functions applied to describe the growth curves in Toy Poodle puppies.
Table 2. Demographic data and management of the Toy Poodle dogs (n = 65) according to sex. Descriptive statistics: means ± SD or numbers and percentages.
Figure 1. Changes in body weights (g) as a function of age (weeks) obtained with the observed curve and the three different growth models for Toy Poodle dogs.
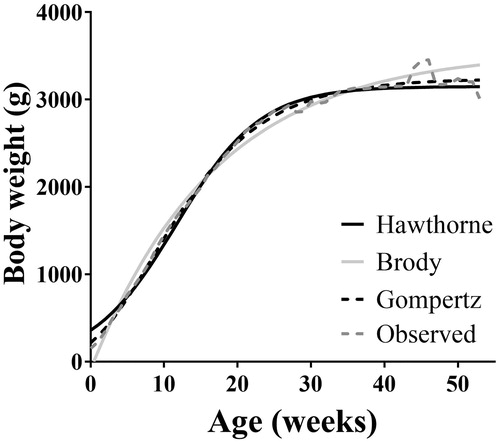
Table 3. Growth characteristics and goodness of fit of growth curves calculated on 65 Toy Poodle dogs (30 males and 35 females).
Figure 2. Differences between mean observed and predicted values for the body weight (BW) of Toy Poodle dogs at different ages obtained by three different models.
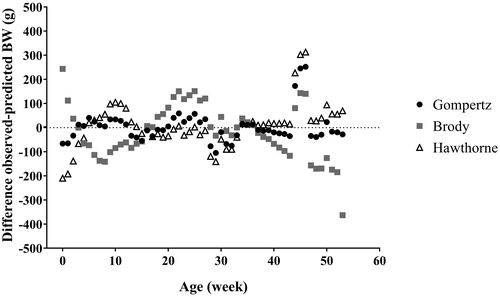
Figure 3. Growth chart percentiles for males Toy Poodle puppies.
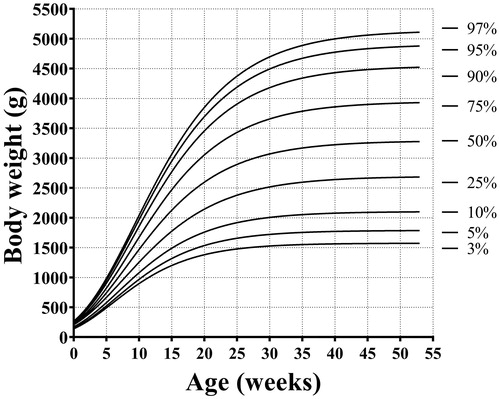
Figure 4. Growth chart percentiles for females Toy Poodle puppies.
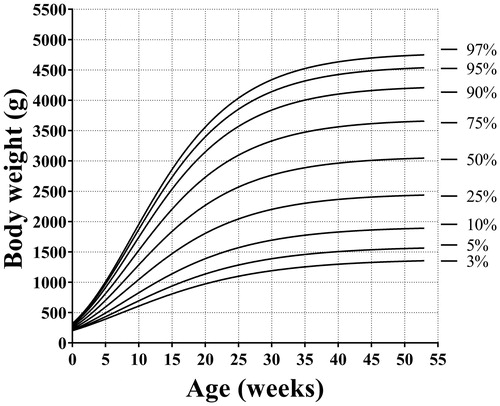
Table 4. Factors affecting the weight of puppies at different ages, from 1 week to 3 months of age (12 weeks).
Table 5. Fixed-effect estimates and significance for model of the predictors of adult body weight (b coefficient, standard error of b and significance of b).