Figures & data
Table 1. Socio-demographic characteristics of the two target groups (ncattle vets = 422, npig vets = 96).
Table 2. Opinions on AMU and antimicrobial prescribing habits of survey respondents (ncattle vets = 422, npig vets = 96).
Table 3. Respondents’ agreement with some statements on AMU and AMR (ncattle vets = 422, npig vets = 96).
Table 4. Factors influencing the choice of antibiotics to be prescribed. Median values (Likert scale from 1 minimum to 10 maximum, ntotal sample = 372, ncattle vets = 304, npig vets = 68).
Table 5. Main alternative strategies suggested by the cattle veterinarians and the pig veterinarians (total occurrences and percentages, ncattle vets = 196, npig vets = 47).
Figure 1. Word cloud of the strategies proposed by the cattle veterinarians. aWords with a greater number of occurrences included ‘Rearing farm’, ‘Animal’, ‘Farmer’, ‘Biosecurity’, ‘Veterinarian’, ‘Antibiotic’, ‘Animal welfare’, and ‘Welfare’.
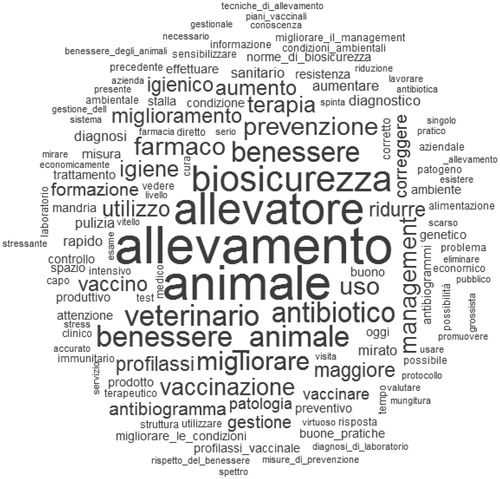
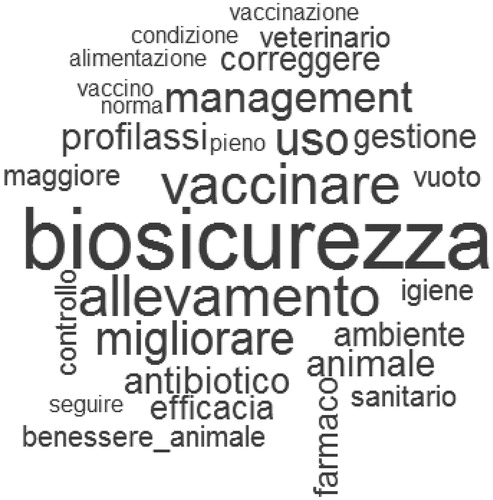
Figure 2. Word cloud of the strategies proposed by the pig veterinarians. aWords with a greater number of occurrences included ‘Biosecurity’, ‘Rearing farm’, ‘Vaccinate’, and ‘Improve’.