Figures & data
Table 1. Cattle cytochrome P450 3A missense single-nucleotide variants subject of investigation in the present study: IDs, functional impact on CYP3A activity and frequency in Limousine cattle breed.
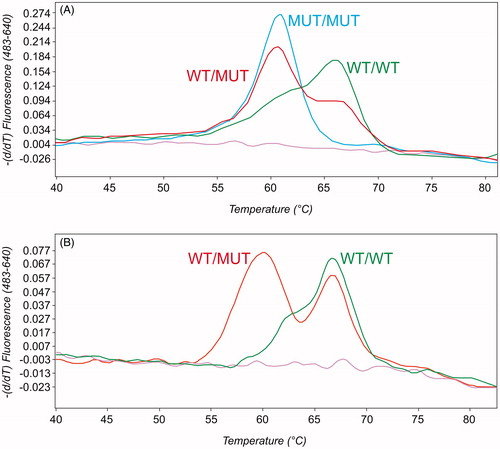
Figure 1. Output of NM_001099367.1:c.589G > A (A) and NM_001099367.1:c.1162A > G (B) melting curve genotyping assays (LightCycler 480 software release 1.5, Roche). WT/WT (wild type), WT/MUT (heterozygous), and MUT/MUT (mutant) genotypes are indicated with green, red and blue curves, respectively. The BLANK (no template control) is shown in purple.