Figures & data
Figure 1. Impacts of climate change on livestock health and pathogens (Özkan et al. Citation2016).
Figure 2. Scenario in year 2050 with climate sensitivity equal to 5.5 °C annual mean temperature with extreme events calibration (Source: figure taken from https://sedac.ciesin.columbia.edu/mva/ccv/… and adapted for illustrative purpose only).
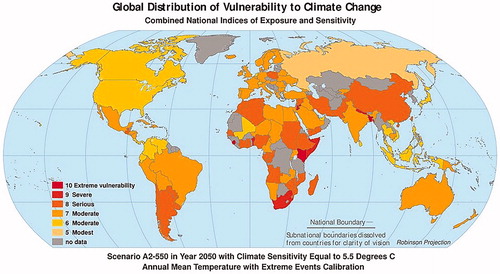
Figure 3. Scenario in year 2100 with climate sensitivity equal to 1.5 °C annual mean temperature with extreme events calibration (Source: figure taken from https://sedac.ciesin.columbia.edu/mva/ccv/… and adapted for illustrative purpose only).
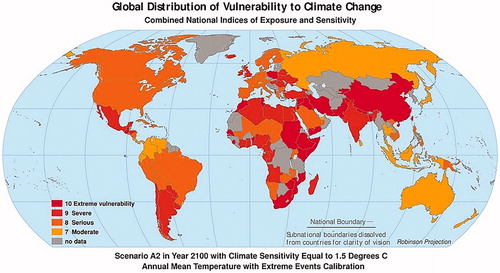
Figure 4. (a) Overview of the livestock of the world: data set for dairy and beef cattle (Source: figure taken from http://www.fao.org/livestock-systems/global-distributions/cattle/en/ and adapted for illustrative purpose only). (b) Overview of the livestock of the world: data set for goat (Source: figure taken from http://www.fao.org/livestock-systems/global-distributions/goats/en/ and adapted for illustrative purpose only). (c) Overview of the livestock of the world: data set for sheep (Source: figure taken from http://www.fao.org/livestock-systems/global-distributions/sheep/en/ and adapted for illustrative purpose only).
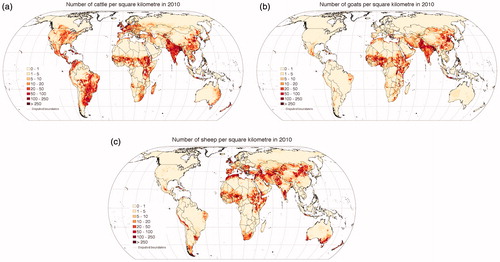
Table 1. Mitigation measures adopted by breeders to reduce ammonia emission (O’Brien et al. Citation2020).
Table 2. Adaptation measures adopted by breeders to improve the microclimate of livestock (Pirlo and Caré Citation2013; O’Brien et al. Citation2020).
Figure 5. The ability of one genotype to produce more than one phenotype when exposed to different environments (each of the coloured lines is a ‘reaction norm’) (Kelly et al. Citation2012).
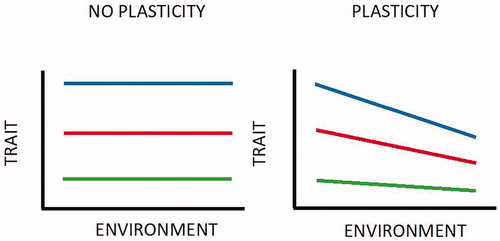
Table 3. Functions of candidate genes associated with at least one climatic covariable (Flori et al. Citation2019).
Figure 6. Hypothetical response of a dairy cow to increased heat stress (Source: Misztal Citation2017). In yellow and red two different temperature levels (in red the hottest temperature).
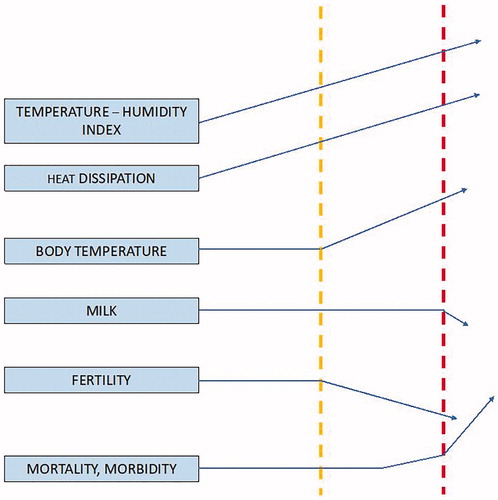
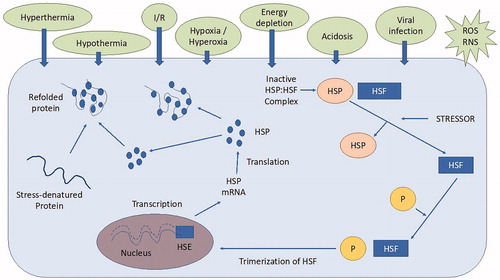
Figure 7. Molecular mechanism of heat shock protein (HSP) synthesis: the heat shock factors (HSF) present in the cytosol are bound with HSP to maintain an inactive state. The wide variety of heat stressors (HS) can activate the HSF causing them to get detached from HSP. Then, HSF are phosphorylated (P) by protein kinases to form trimers in the cytosol. This HSF trimer complex enters the nucleus and bind with heat shock elements (HSE) in the promoter region of the HSP gene. HSP70 mRNA is then transcribed and leaves the nucleus into the cytosol where new HSP70 is synthesised. The newly synthesised HSP protects the cells by acting as a molecular chaperone facilitating the assembly and translocation of newly synthesised proteins within the cell and repairing and refolding damaged proteins in heat stressed subjects (Source: Sejian et al. Citation2019). I/R: ischemia/reperfusion; ROS: reactive oxygen species; RNS: reactive nitrogen species.