
Figures & data
Table 1. Ingredient and nutrient composition of experimental diets (% as fed).
Figure 1. Relationship between the Ca intake and the body weight gain (BWG) and feed conversion ratio (FCR) of broilers.
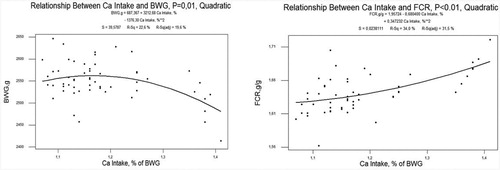
Table 2. Effects of different dietary Ca and non-phytate P levels on feed intake (FI), body weight gain (BWG), feed conversion ratio (FCR), mortality (%) and European Production Efficiency Factor (EPEF) and Ca and non-phytate P intake (% of BWG) in broiler chickens.
Table 3. Effects of different dietary Ca and non-phytate P levels on relative weights (weight/BW, %) of carcase and cuts up, and tibia weight (weight/BW, %), tibia ash (% of tibia dry matter weight) and tibia phosphorus (% of tibia ash weight).