Figures & data
Figure 1. Distribution of the 23 farms involved in the study in the province of Bolzano.
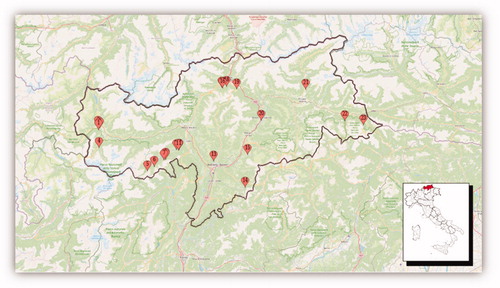
Figure 2. Distribution of calvings of primiparous (dashed bar, n = 154) and multiparous (solid bar, n = 366) cows across calving seasons.
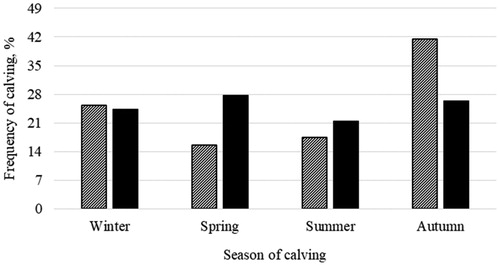
Table 1. Descriptive statistics of milk yield, composition, somatic cell score, coagulation properties, casein fractions, minerals and fatty acid (FA) composition of Original Brown cows.
Table 2. Pearson correlations between milk yield (kg/d), composition traits, coagulation parameters, casein fractions (% crude protein), and minerals (mg/kg).
Table 3. Pearson correlations between individual and groups of milk fatty acids (g/100 g total FA) with milk yield, composition traits, coagulation parameters, casein fractions (% crude protein), and minerals (mg/kg).
Table 4. Least squares means of milk yield, composition, somatic cell score, coagulation properties, casein fractions, minerals and fatty acid (FA) composition across parities.
Figure 3. Least squares means of (a) fat, protein and casein content, and (b) lactose content and somatic cell score (SCS) throughout lactation.
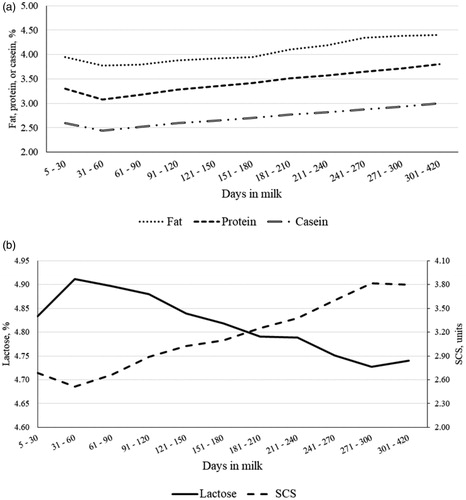
Figure 4. Least squares means of (a) rennet coagulation time (RCT), curd firmness 30 min after enzyme addition to milk (a30) and curd-firming time (k20), and (b) α-casein, β-casein and κ-casein fractions throughout lactation.
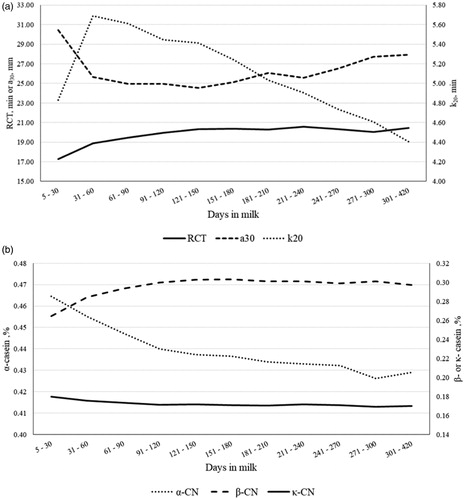
Figure 5. Least squares means of milk (a) Ca, K and P, and (b) Mg and Na throughout lactation.
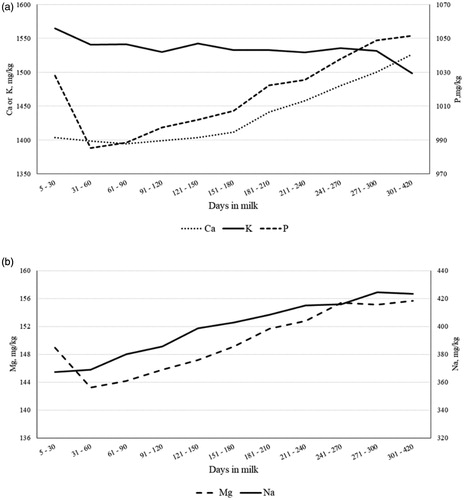
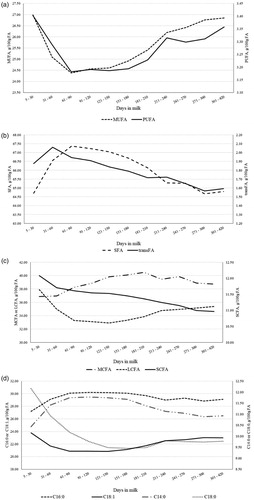
Figure 6. Least squares means of (a) monounsaturated (MUFA) and polyunsaturated fatty acids (PUFA), (b) saturated (SFA) and trans fatty acids (trans FA), (c) short-chain (SCFA), medium-chain (MCFA) and long-chain fatty acids (LCFA), and (d) individual fatty acids throughout lactation.