Figures & data
Table 1. Ingredients and chemical composition of milk replacer and feedstuff fed in the experiment.
Table 2. Average score values, number of observations per score (n-Sc) and scores frequency (Sc%) of daily clinical sign evaluation of male calves (from 16 to 72 days of age) affected by short and medium chain fatty acids (SMCFA) added to milk.
Table 3. Therapy used in case of calf illness (from 16 to 72 days of age) affected by short and medium chain fatty acids (SMCFA) added to milk.
Table 4. Blood parameters of male calves (from 16 to 72 days of age) affected by short and medium chain fatty acids (SMCFA) added to milk.
Table 5. β-hydroxybutyrate (BHBA) and nonesterified fatty acids (NEFA) fluctuations in blood of male calves (from 16 to 72 days of age) affected by short and medium chain fatty acids (SMCFA) added to milk.
Table 6. Body development measurements: growth, feed efficiency (FE) and feed conversion rate (FCR) of male calves (from 16 to 72 days of age) affected by short and medium chain fatty acids (SMCFA) added to milk.
Table 7. Individual intake in the 56 days of experimental period, final body weight (BW) and gut macroscopic measurements (at 72 days of age) of male calves as affected by milk added with short and medium chain fatty acids (SMCFA).
Figure 1. Regression between the average count of haemolytic Escherichia coli in faeces during the whole trial, expressed as Colony Forming Unit (CFU) and the relative final body weight (% of initial body weight - BW) of the Control (C–white circles, dotted line) and Treated (T–black circles, continuous line) group of male calves (from 16 to 72 days of age). The T group received 11 g/day of short and medium chain fatty acids (SMCFA) dissolved in milk.
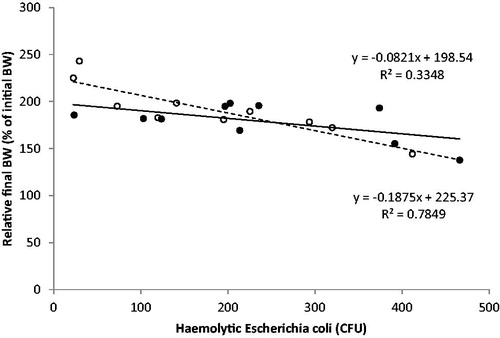
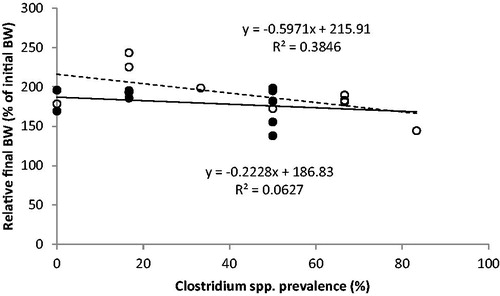
Figure 2. Regression between the average individual prevalence of Clostridium spp. in faeces during the whole trial (%), and the relative final body weight (% of initial body weight - BW) of the Control (C–white circles, dotted line) and Treated (T–black circles, continuous line) groups of male calves (from 16 days to 72 of age). The T group received 11 g/day of short and medium chain fatty acids (SMCFA) dissolved in milk.