
Figures & data
Figure 1. Schematic illustration of the experimental design.
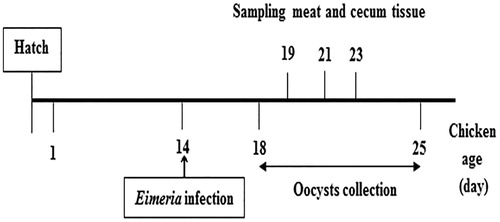
Table 1. Chemical composition of commercial basal diet.
Table 2. PCR primers targeting the ITS-1 of E. tenella.
Figure 2. PCR amplification of genomic DNA using ITS-1 primers of E. tenella. M: 100 bp DNA ladder.
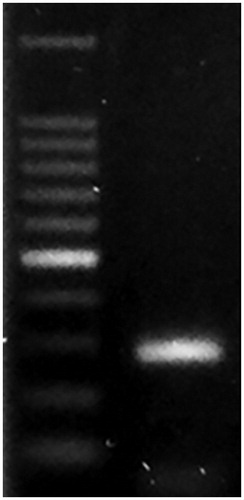
Figure 3. Oocysts shedding patterns of E. tenella in faeces. Note that the peak point of oocyst production for E. tenella is at 7 dpi.
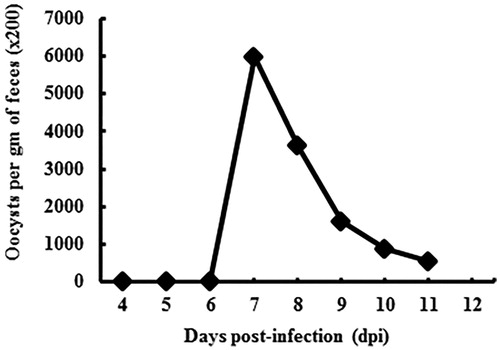
Figure 4. Haematoxylin and eosin stained section of E. tenella infected caeca at 5 dpi (A), 7 dpi (B), and 9 dpi (C) (400×). Schizont is observed at 5 dpi. Oocyst is observed at 7 dpi. It is normal at 9 dpi. O: oocyst; S: schizont.
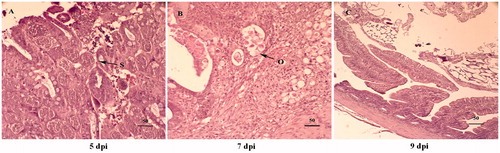
Table 3. Meat quality parameters and TBARS values of breast muscles of broiler chickens artificially infected with 1 × 10⁴ sporulated oocysts of E. tenella.
Table 4. Blood parameters of broiler chickens artificially infected with 1 × 10⁴ sporulated oocysts of E. tenella.
Table 5. Fatty acid compositions in breast muscles of broiler chickens artificially infected with 1 × 10⁴ sporulated oocysts of E. tenella.
Table 6. Mineral contents in breast muscles of broiler chickens artificially infected with 1 × 10⁴ sporulated oocysts of E. tenella.