
Figures & data
Table 1. Effects of dietary treatments on rumen parameters.
Figure 1. Temporal evolution of rumen NH3 production during the trial.
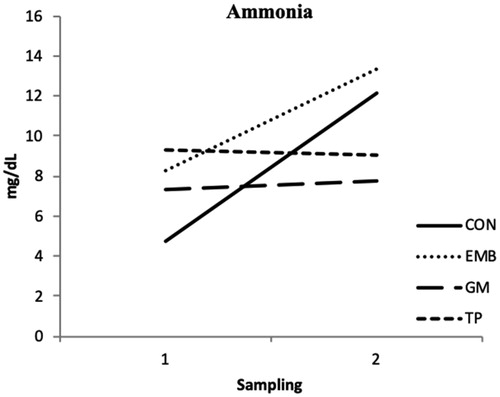
Table 2. Diet’s effect on biodiversity indices of rumen microbial population.
Figure 2. Violin plot of alpha diversity as measured with different metrics. Different colours indicate different diet treatments, violin shapes represent all possible results, with thickness indicating density. No significant differences at p < .01 were observed between groups.
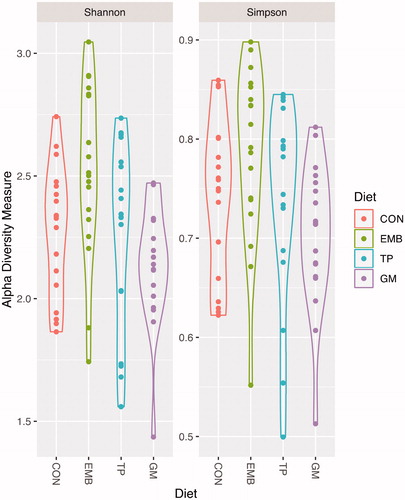
Figure 3. Beta diversity. Non-metric multidimensional scaling (NMDS) based on Bray–Curtis dissimilarity matrix shows time as possible element of diversity between samples.
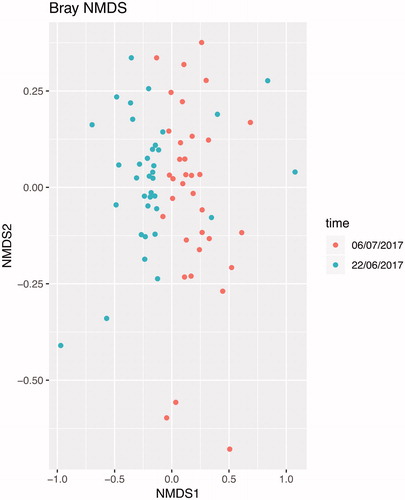
Table 3. Taxonomic identity of the rejected hypotheses in EMB vs CON Diet.
Table 4. Taxonomic identity of the rejected hypotheses in GM vs CON Diet.
Table 5. Taxonomic identity of the rejected hypotheses in TP vs CON Diet.