
Figures & data
Table 1. Source of genome-wide data and sample size of analysed breeds.
Figure 1. Distribution of single nucleotide polymorphisms (SNPs) (left y axis) and average minor allele frequency (MAF) frequency (right y axis) across autosomes.
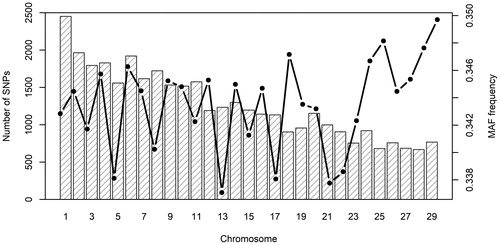
Table 2. Genetic diversity indices for each breed.
Table 3. The length (Mbp) and number (in brackets) of homozygous stretches for each run of homozygosity (ROH) category and breed.
Figure 2. Autosome-specific proportion of run of homozygosity (ROH) stretches with a minimum length 1 megabase pair (Mbp).
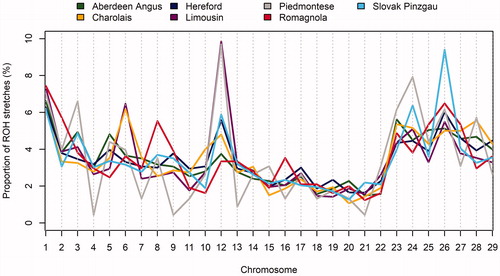
Figure 3. Relationships between the number and length of run of homozygosity (ROH) stretches (4–8 Mbp, 8–16 Mbp and > 16 Mbp). Mbp: megabase pair.
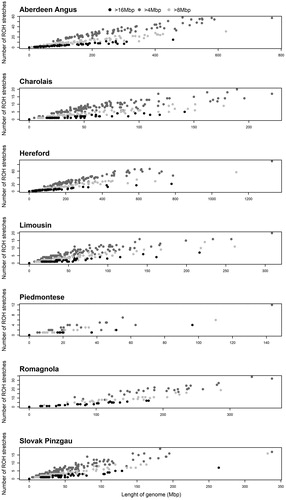
Table 4. Genomic inbreeding (%) derived from run of homozygosity (ROH) stretches with different length (4–8 Mbp, 8–16 Mbp and > 16 Mbp) for each breed.
Table 5. Average level of linkage disequilibrium in the genome of the studied breeds.
Figure 4. The relationship between linkage disequilibrium (LD) and inter-marker distance.
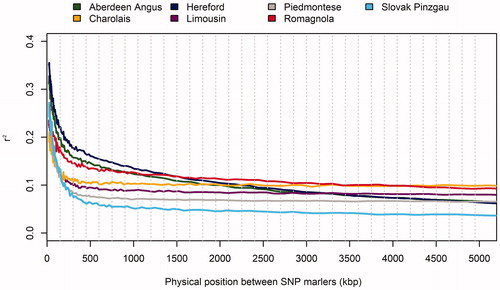
Figure 5. The trend of effective population size for the analysed breeds over the last 60 generations.
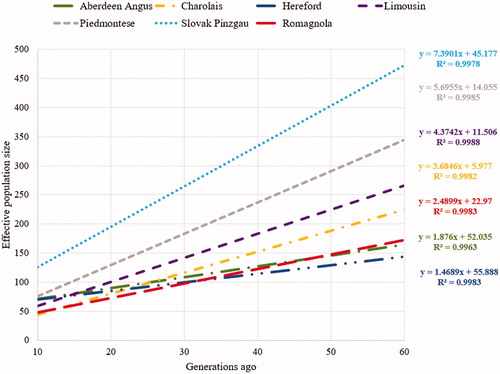
Figure 6. Genetic differentiation within and between evaluated populations based on discriminant analysis of principal components (DAPC) (A), first discriminant function of DAPC (B) and individual membership probabilities suggested by a model-based Bayesian clustering approach (C).
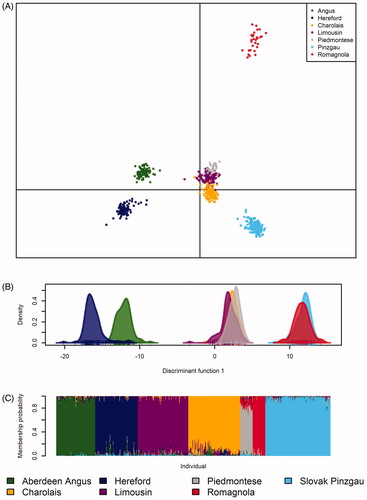
Table 6. Genetic relationships among populations based on the Wright’s statistics (under the diagonal) and Nei’s genetic distances (above the diagonal).
Table 7. The membership proportion of individual breeds.