
Figures & data
Figure 1. Least-squares means of litter size (LS) across parities in Florida and Payoya breeds.
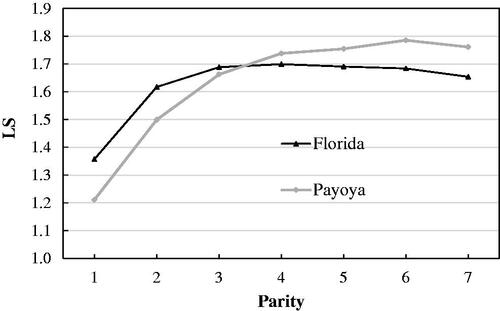
Figure 2. Least-squares means of number of kids born alive (NBA) across parities in Florida and Payoya breeds.
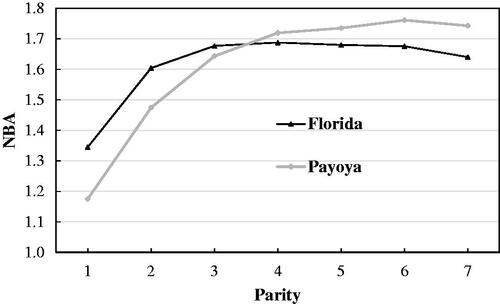
Table 1. Distribution of data over parities in Florida and Payoya breedsa.
Table 2. Estimates of variance components, heritabilities, and repeatabilities for litter size (LS) across parities in Florida and Payoya breeds using a threshold random regression modela.
Table 3. Estimates of variance components, heritabilities, and repeatabilities for number of kids born alive (NBA) across parities in Florida and Payoya breeds using a threshold random regression modela.
Table 4. Estimates of additive genetic correlations (above diagonal) and phenotypic correlations (below diagonal) between litter size (LS) across parities in Florida breed using a threshold random regression model.
Table 5. Estimates of additive genetic correlations (above diagonal) and phenotypic correlations (below diagonal) between litter size (LS) across parities in Payoya breed using a threshold random regression model.
Table 6. Estimates of additive genetic correlations (above diagonal) and phenotypic correlations (below diagonal) between number of kids born alive (NBA) across parities in Florida breed using a threshold random regression model.
Table 7. Estimates of additive genetic correlations (above diagonal) and phenotypic correlations (below diagonal) between number of kids born alive (NBA) across parities in Payoya breed using a threshold random regression model.
Table 8. Estimates of phenotypic (rp) and additive genetic (rg) correlations between litter size (LS) and number of kids born alive (NBA) across parities in Florida and Payoya breeds using a threshold random regression model.