Figures & data
Table 1. Ethogram used during the study. The behaviour was recorded using a 1/0 sampling method.
Table 2. Type of profile attributed to each cat based on the behaviour showed during the veterinary examination of 95 cats taken to a veterinary clinic in the south of Italy.
Table 3. Classification of the explanatory variables considered in the study with data collected from 95 cats taken to a veterinary clinic in the south of Italy.
Table 4. Descriptive statistics of the data collected from 95 cats taken to a veterinary clinic in the south of Italy.
Table 5. Descriptive statistics of rectal temperature (RT), respiratory rate (RR), and heart rate (HR) recorded in 95 cats during a veterinary visit.
Figure 1. Association between the age and the profile of the cat subjected to a veterinary visit.
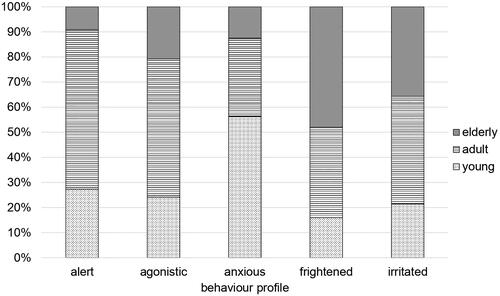
Figure 2. Association between the gender and the profile of the cat subjected to a veterinary visit.
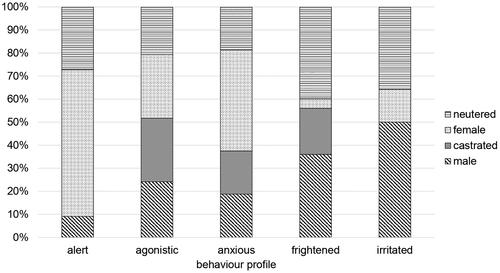
Figure 3. Multiple Correspondence Analysis (MCA) biplot. The plot reports the observations distinguished on the basis of the cats’ profile and the vectors (red arrows) representing the variables with the greatest effect on the two new dimensions (Dim1 and Dim2).
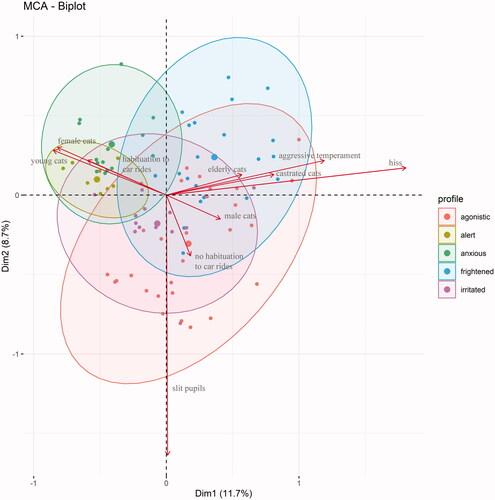
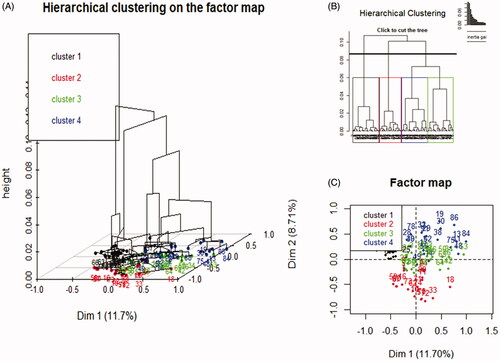
Figure 4. The results of the Hierarchical Clustering on Principal Components (HCPC) analysis. The 3D tree (A) displaying the hierarchy of the variables affecting the most the creation of the four clusters, the representation of the chosen height (0.06) to perform the cut of the hierarchical clustering tree (B), and the (Multiple Correspondence Analysis (MCA) biplot with the four clusters obtained from HCPC analysis (C).