Figures & data
Figure 1. Normal distribution and statistical analysis of the liver weight (N = 42). Normal distribution curve of liver weight in Xupu geese, dashed vertical axis represents mean of the average liver weight (576.5 g), the left part of the arrow showed interval of the SL-Xupu geese, the right part of the arrow showed interval of the LL-Xupu geese.
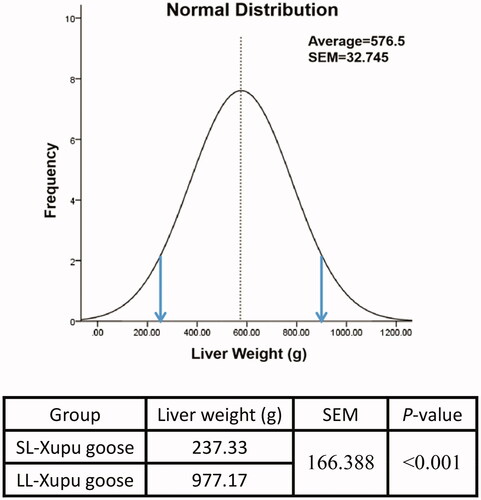
Table 1. The primers used for gene cloning, quantitative real-time PCR.
Table 2. Comparison of overfeeding performance between LL-Xupu geese and SL-Xupu geesea.
Figure 2. Effects of overfeeding between LL-Xupu geese and SL-Xupu geese. (A) Histology observation of SL-Xupu geese liver (200 ×). (B) Histology observation of LL-Xupu geese (200 ×).
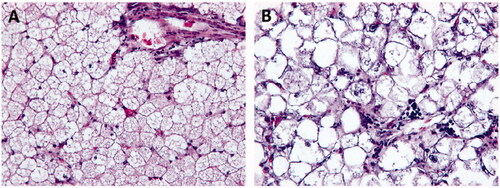
Table 3. Comparison of fatty acid composition between LL-Xupu geese and SL-Xupu geese (% of total fatty acids)a.
Table 4. Comparison of plasma biochemical metabolites between LL-Xupu geese and SL-Xupu geesea.
Table 5. Comparison of enzyme activities in blood and liver between LL-Xupu geese and SL-Xupu geesea.
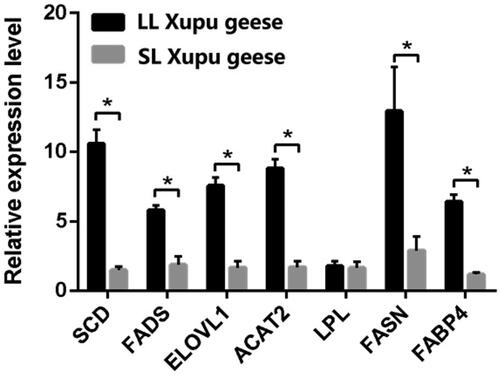
Figure 3. Comparison of lipid metabolism-related genes expression in liver between LL-Xupu geese and SL-Xupu geese. The sign ‘*’ indicated p < .05. SCD: stearoyl-CoA desaturase gene; FADS: fatty acid dehydrogenase gene; ELOVL1: elongase of long-chain fatty acid 1 gene; ACAT2: acyl-coenzyme A: cholesterol acyltransferase 2 gene; LPL: lipoprotein lipase gene; FASN: fatty acid synthase gene; FABP4: adipocyte fatty acid binding protein gene.